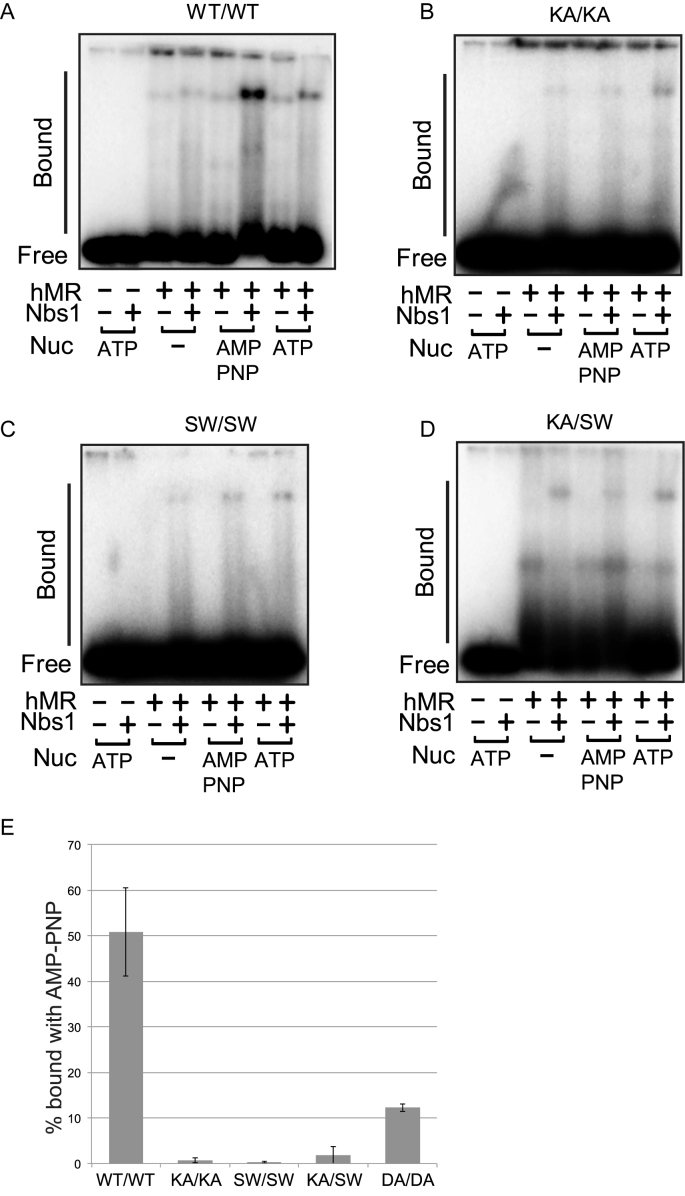
Figure 5.
(A) DNA binding assays were performed with hMR complexes at 37°C for 15 min. Reactions contained 25 nM hMR, 25 nM Nbs1 and 1 mM ATP or AMP–PNP as indicated, as well as 5 mM MgCl2. The bound species were separated on a 1.2% agarose gel and analyzed by phosphorimager. (B) DNA binding assays were performed with KA–KA hMR complexes as in (A). (C) DNA binding assays were performed with SW–SW hMR complexes as in (A). (D) DNA binding assays were performed with KA–SW hMR complexes as in (A). (E) DNA binding assays were performed with WT and mutant hMR complexes as in (A). The level of protein–DNA bound species formed by recombinant MRN complexes in the presence of Nbs1 and AMP–PNP were quantitated. Results are shown from three independent experiments and error bars indicate standard deviation.

