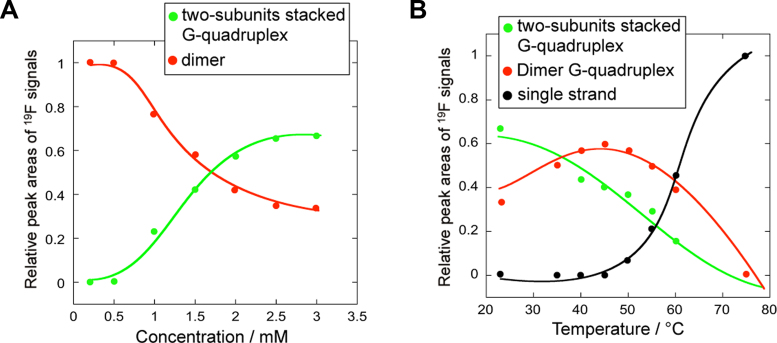
Figure 3.
19F NMR shift versus concentration and temperature profiles. (A) Profiles of the relative peak areas of the 19F resonance signals versus concentration. Dimer and two-subunits stacked G-quadruplex conversions followed by 19F NMR spectroscopy. (B) Profiles of the relative peak areas of the 19F resonance signals versus temperature. Two-subunits stacked G-quadruplex/dimer G-quadruplex/single strand conversions followed by 19F NMR spectroscopy. To obtain the relative peak signal of each conformation, the total value of the relative peak signal for three conformations was estimated to be 1.0. Plotting the values of relative peak signal against temperature results in two melting curves for the two-subunits stacked Gquadruplex and dimer G-quadruplex.

