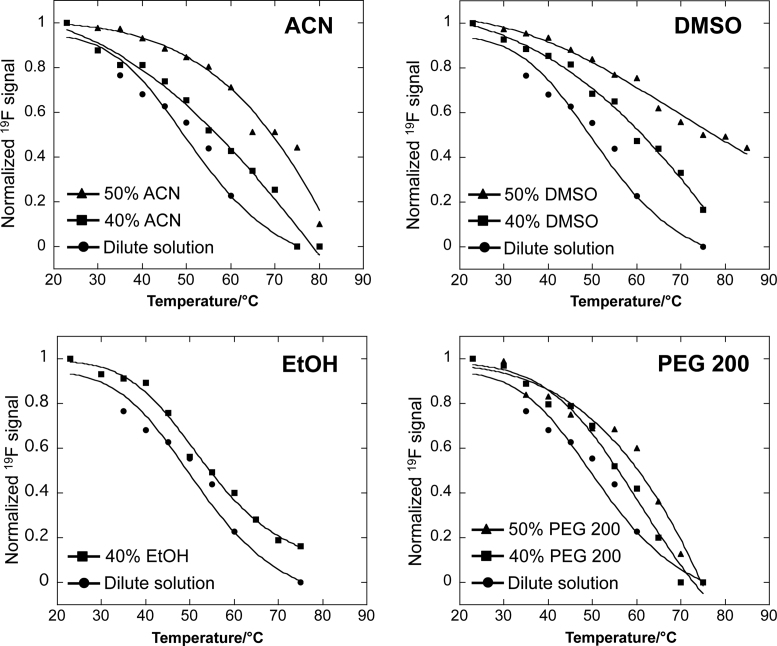
Figure 7.
Melting profiles of the relative peak areas of the 19F resonance signals versus temperature. The profiles were obtained by plotting the normalized two-subunits stacked G-quadruplex relative peak areas of the 19F resonance signals in NMR spectra (Figure 2C, Figure 6 and Supplementary Figure S14) as a function of temperature.

