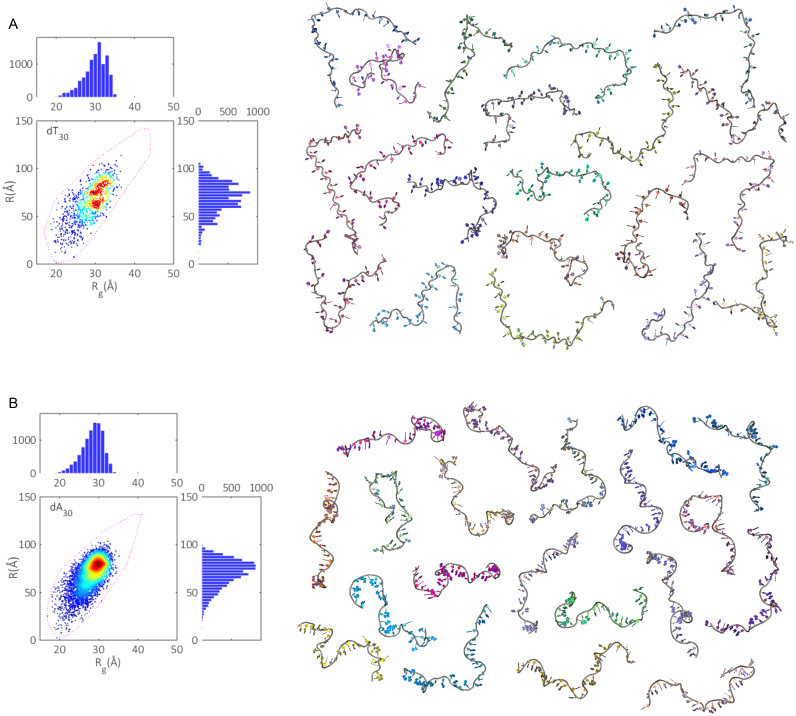
Figure 9.
Conformational spaces (Rg and R) were formed from every selected model in the (A) dT30 ensembles and (B) dA30 ensembles (500 sets of 20 models for a total of 10 000 points) (left). Projections onto 1d Rg and R histograms are also shown. On the right, one of the 500 sets of 20 member ensembles reconstituting the experimental curves are displayed. These ensemble structures are available on SASBDB, (dT30: SASDBD6, dA30: SASDBE6). The repeatability of the conformational spaces is demonstrated in Supplementary Figure S5.

