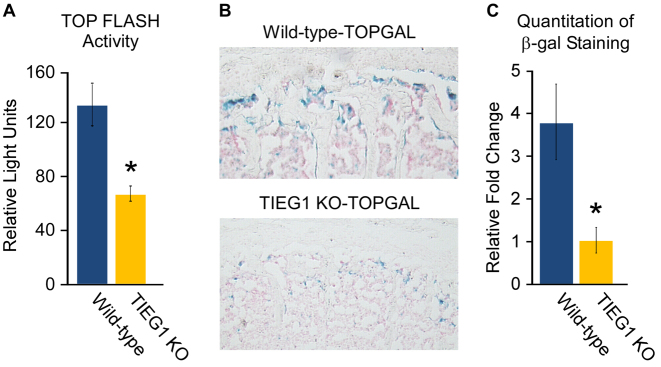
Figure 3.
Wnt pathway activity in calvarial osteoblasts and bones of TIEG1 KO mice. (A) TOP FLASH reporter construct activity in WT and TIEG1 KO calvarial osteoblast cells. (B) LacZ staining in sections of L5 vertebrae isolated from WT-TOPGAL and TIEG1 KO-TOPGAL mice. Blue staining represents cells with active Wnt signaling. (C) Graph depicting quantitation of LacZ staining in 10 WT-TOPGAL and 10 TIEG1 KO-TOPGAL mice. * denotes significance at P < 0.05 relative to WT controls.

