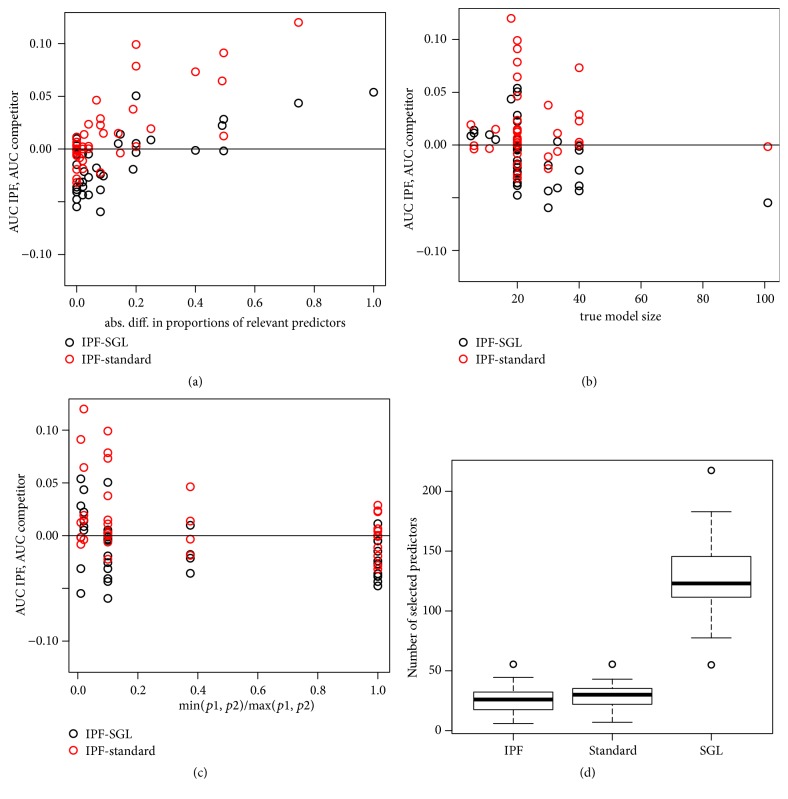
Figure 2.
Panels (a), (b), and (c): difference Δ between the median AUC of IPF-LASSO and the median AUC of the standard LASSO (red points) and between the median AUC of IPF-LASSO and the median AUC of SGL (black points) against simulation parameters. A positive difference indicates better performance of IPF-LASSO. Each point on the scatterplots represents one of the 6 + 33 = 39 simulation settings. Panel (a): Δ against the absolute difference |p 1 r/p 1 − p 2 r/p 2| between the proportions of relevant variables in the two modalities. Panel (b): Δ against the true model size p 1 r + p 2 r. Panel (c): Δ against a measure of the relative size of the modalities: min(p 1, p 2)/max(p 1, p 2). Panel (d): Median number of selected variables for IPF-LASSO, standard LASSO, and SGL. Each boxplot represents the values obtained for the 33 + 6 = 39 settings.

