
Figure 4.
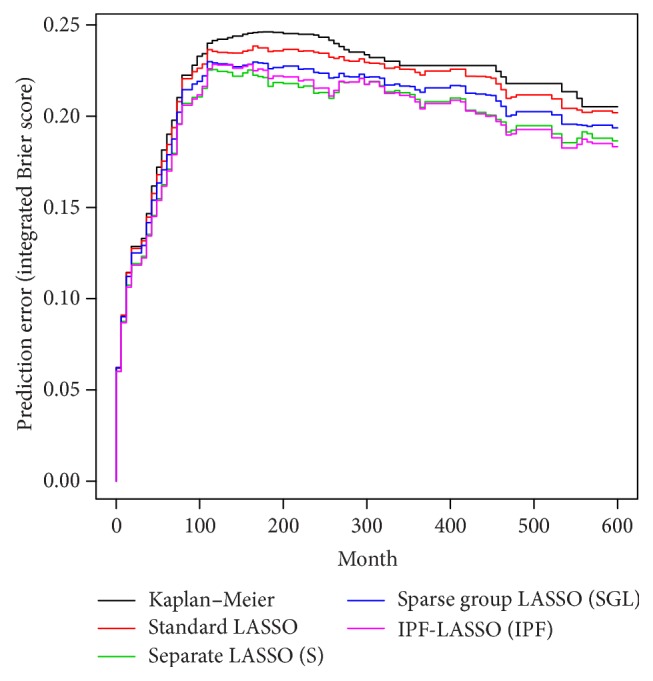
AML data. Prediction error curves computed up to 5 years for the models obtained by standard LASSO (red line), S (green line), SGL (blue line), and IPF-LASSO (purple line). The black line represents the prediction error obtained with the null model (no variables).