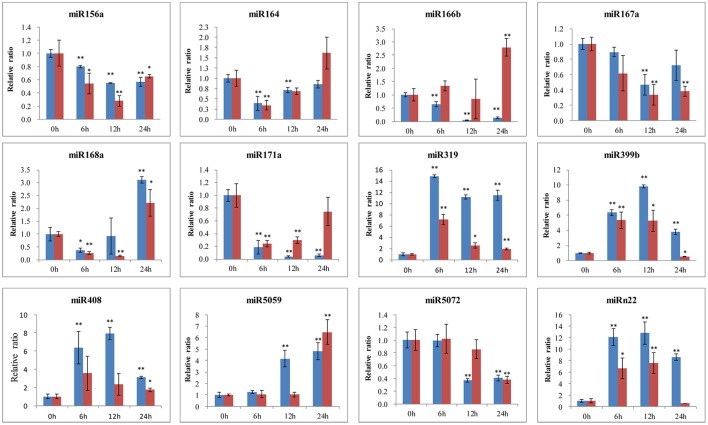
Figure 8.
qRT-PCR validation of B. elliptica-responsive miRNAs in lily. The blue bar represents the resistant L. regale, and the red bar represents the susceptible “Tresor.” The amount of expression was normalized to the level of 18S rRNA. The normalized miRNA levels at 0 h were arbitrarily set to 1. Each bar shows the mean ± SE of triplicate assays. * or ** indicates a statistically significant difference as relative to the value at 0 h for each miRNAs at p < 0.05 or 0.01, respectively.

