
FIGURE 6.
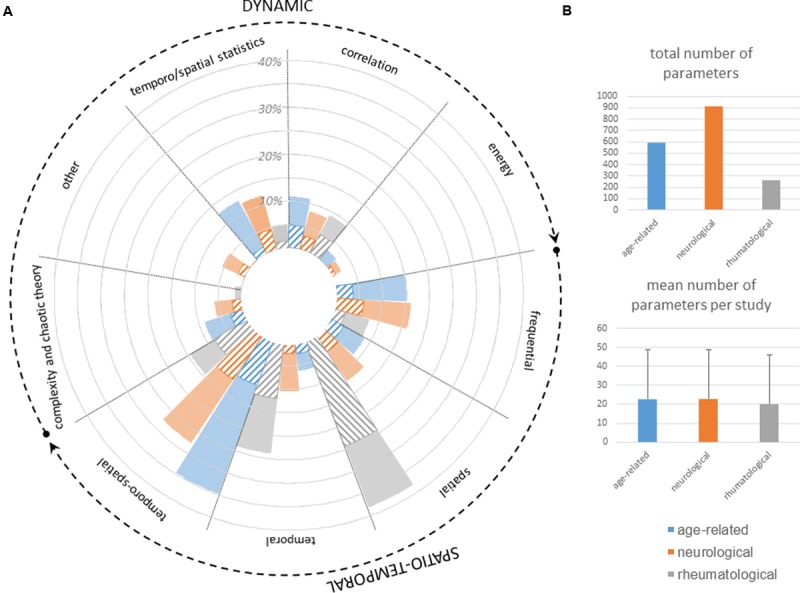
Analysis used to compute gait features of neurologic patients as well as rheumatologic and gerontologic patients for comparison. (A) Fully colored slices represent the percentage of total number of parameters computed in studies from the specialty (neurology, rheumatology, age-related) by using the method specified on top of the slice. Striped slices represent the percentage of parameters computed in studies from the specialty (neurology, rheumatology, age-related) that could discriminate between two cohorts in at least one study. (B) Total number of parameters (including all studies) and mean number per study computed in studies from the specialty (neurology, rheumatology, age-related).