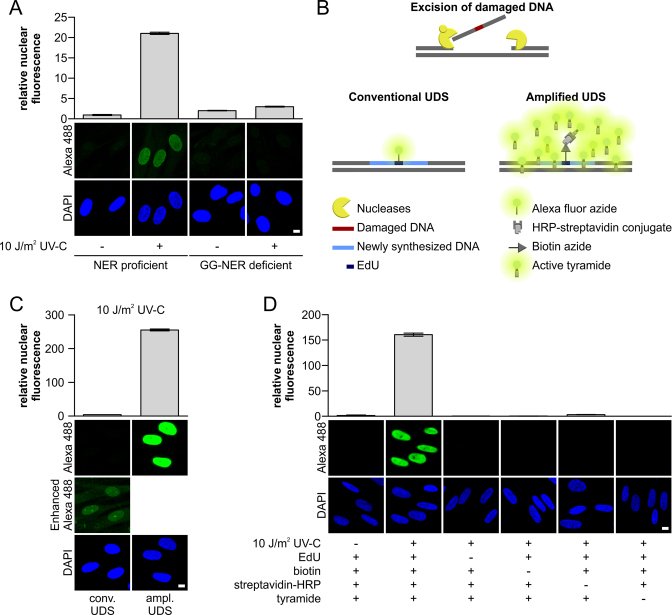
Figure 1.
TSA-mediated amplification of UDS signals. (A) VH10 (NER-proficient) or XP186LV (XPC-deficient) cells grown on cover slips were irradiated with UV-C (10 J/m2) or mock-treated as indicated, and subsequently labeled for 3 h with EdU. The UDS signal (n > 300 cells per condition, three independent experiments) was quantified (upper panel) by confocal microscopy measurement of the total nuclear fluorescence (Alexa-Fluor 488 nm) and expressed as relative nuclear fluorescence. Representative images are shown (lower panel). Gap-filling synthesis measured by EdU-based UDS without signal amplification was only observed in GG-NER-proficient cells (VH10), whereas no TC-NER specific signal could be measured in XP-C cells (XP186LV). (B) Schematic overview of the different labeling approaches used by conventional and amplified UDS. The key difference is the number of fluorophores per incorporated nucleotide, where one fluorophore binds to one incorporated EdU in conventional UDS, multiple fluorophores can be bound in the proximity of 1 EdU in the amplified UDS, which is mediated by HRP activation of tyramide-labeled Alexa 488. (C) VH10 cells grown on a coverslip were UV-irradiated (10 J/m2) or left untreated (Supplementary Figure S1E), and subsequently labeled for 3 h with EdU. UV-induced gap-filling synthesis was measured by conventional or amplified UDS (tyramide-based signal amplification). UDS signals were quantified based on the total signal intensity of Alexa-Fluor 488 nm per nucleus. Comparing the amplified UDS assay with the conventional UDS indicated amplification of the UDS signal by >60 times (n > 380 cells per condition, two independent experiments). Representative images are shown (lower panel). To visualize the UDS signal in the conventional UDS assay, the fluorescent signal was digitally amplified for the image labeled as ‘Enhanced Alexa 488’. (D) Quantification of the amplified UDS signal in VH10 cells (n > 250 cells per condition, two independent experiments) where essential components of the EdU-based Click-it chemistry reaction and TSA amplification were omitted as indicated by (–). Representative images are shown (lower panel). Nuclei were visualized using the DNA marker DAPI. SEM is shown. Scale bar: 10 μm.

