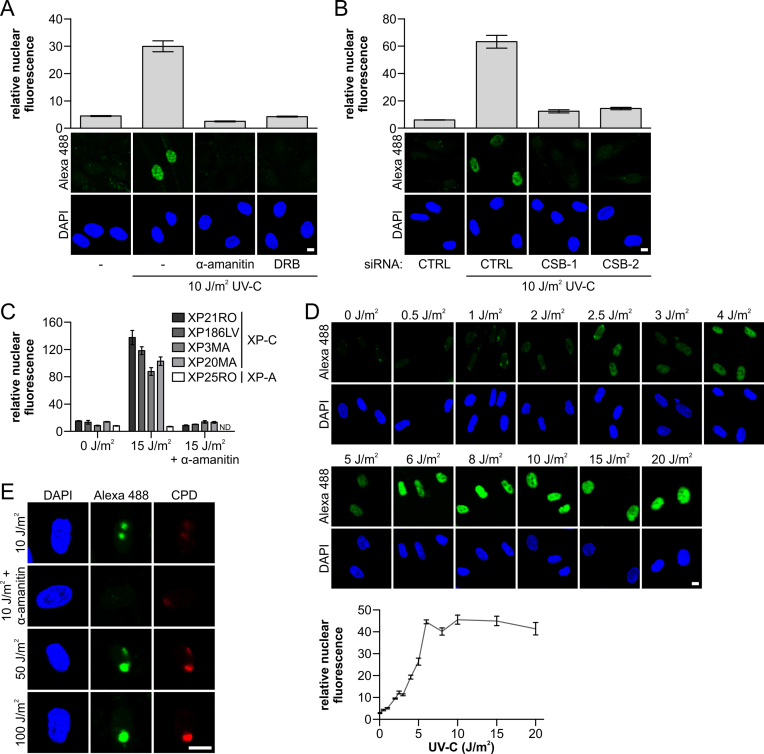
Figure 3.
Gap-filling activity of TC-NER can be measured quantitatively with amplified UDS. (A) GG-NER-deficient XP186LV (XP-C) cells were treated with transcription inhibitors (α-amanitin: 25 μg/ml; 16 h before UV-C treatment, DRB: 100 μM; 1 h before UV-C treatment) or mock treated; or (B) transfected with non-targeting control siRNA (CTRL) and two independent siRNAs that targeting CSB (CSB-1 and -2), as indicated. Cells were labeled directly with EdU for 7 h after irradiation with UV-C (10 J/m2), as indicated. (A and B) Amplified UDS signals were quantified (upper panel) by measuring the total nuclear fluorescence (Alexa-Fluor 488 nm, n > 80 cells for each condition, two independent experiments) and representative images (lower panel) are shown. (C) Quantification of the amplified UDS signal measured by the total nuclear Alexa-Fluor 488 nm fluorescence in the indicated XP-C cells (n > 50 cells per condition). The TC-NER specificity of the signal was shown by the loss of signal after transcription inhibition with α-amanitin (25 μg/ml, added 16 h prior to EdU labeling for 7 h) or when amplified UDS signals were measured in an NER-deficient XP-A cell line (XP25RO). ND indicates not determined. Representative images are shown in Supplementary Figure S2C. (D) Representative images (upper panel) of XP-C (XP186LV) cells (n > 170 cells per condition, two independent experiments) irradiated with indicated UV-C doses. Amplified UDS signals were quantified (lower panel) based on total nuclear fluorescence (Alexa-Fluor 488 nm) after EdU labeling for 7 h and they exhibit dose-dependent UDS signals. (E) Representative images of XPC-deficient XP186LV cells where UV-C damage was induced locally with the indicated UV-C doses. Transcription was inhibited by 25 μg/ml α-amanitin at 16 h prior to UV-C damage and during labeling with EdU for 7 h. Sub-nuclear UV-exposed regions were identified by α-CPD staining. Nuclei were identified by DAPI staining. SEM is shown. Scale bar: 10 μM.

