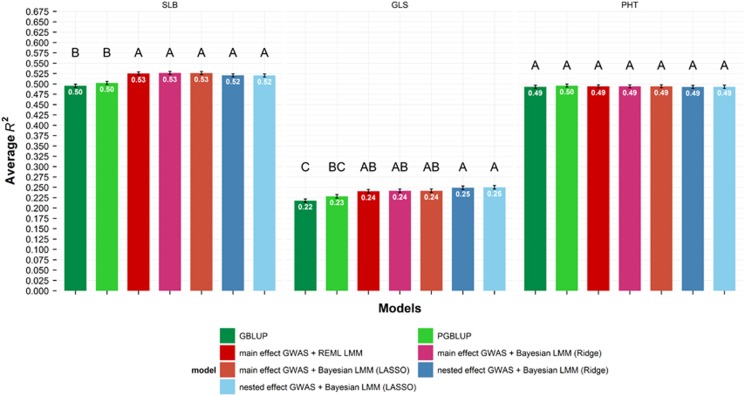
Figure 3.
Within-family prediction ability (R2) for three agronomic traits using GBLUP and new models. S.e. bars are imposed on each mean prediction ability value. Models with different letters above the bar indicate the average prediction R2 values are significantly different (α<0.05; Tukey's honestly significant difference). Prediction R2 values are averages across 25 NAM populations and 50 runs of cross-validations. The main-effect and nested-effect GWAS models failed to detect significant SNPs in 21 and 29 runs, respectively. For those cases, the prediction R2 for the respective models was equal to the corresponding GBLUP models.

