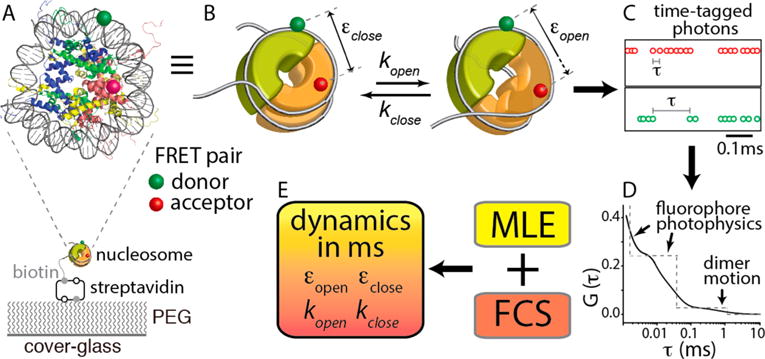
Figure 1.

Schematic representation of the hybrid single-molecule method that revealed histone core dynamics on a millisecond time scale. (A) Nucleosome made with X. laevis core histones and a 147 bp human α-satellite sequence and labeled with a FRET donor [Cy3 (green)] at a DNA region fixed to the (H3–H4)2 tetramer (blue and green proteins) and an acceptor [ATTO647N (red)] at a H2A–H2B dimer (yellow and red proteins) at H2B T112C. The FRET pair reports the positional changes of the dimer relative to the tetramer upon opening and closing of the interface around where the H2A docking domain interacts with the tetramer (purple circle). The nucleosome was immobilized through biotin–streptavidin conjugation on a polyethylene glycol (PEG)-coated cover glass. (B) Kinetic scheme of spontaneous positional dynamics of a histone dimer (the front half-toroid colored orange) relative to the tetramer (the thick half-toroid colored green) between the closed and open states of the dimer–tetramer interface around which the H2A docking domain interacts with the tetramer (purple circle). The gray line represents the nucleosomal DNA. The green and red spheres represent the FRET donor (Cy3) and the acceptor (ATTO647N), respectively. (C) Example of streams of time-tagged fluorescence photons from a FRET pair. (D) Schematic representation of the fluorescence correlation spectrum G(τ) obtained from the intervals between two consecutive photons (τ) as shown in panel C. (E) Hybrid approach combining maximum likelihood estimation (MLE) and fluorescence correlation spectroscopy (FCS) to characterize the histone core dynamics at the dimer–tetramer interface on a millisecond time scale. Further details are described in Experimental Methods.
