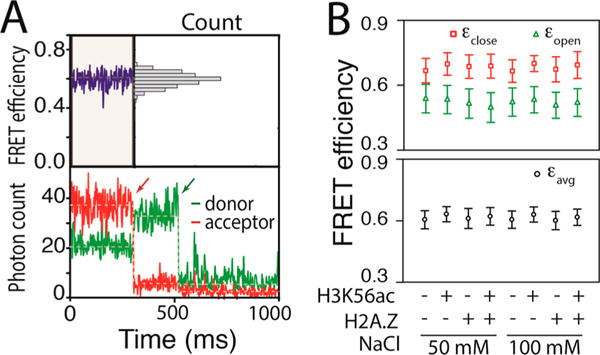
Figure 2.

Maximum likelihood estimation reveals spontaneous structural dynamics of the histone core. (A) Representative fluorescence intensity time traces of a FRET pair (bottom) and the corresponding FRET efficiency trace (top) showing an average apparent FRET efficiency of ~0.6 with a unimodal distribution (top right). The apparent FRET efficiency was calculated with Iacceptor/(Idonor + Iacceptor), where I is the fluorescence intensity. The red and green arrows in the intensity traces indicate time points at which the acceptor and the donor, respectively, were photobleached. (B) MLE results revealing FRET efficiencies of the closed (εclose) and open (εopen) states (top) along with the average FRET efficiency (εavg) (bottom) for the nucleosomes made with the wild-type histone core (WT), the H3K56-acetylated histone core (H3K56ac), the H2A.Z-substituted histone core (H2A.Z), and the H3K56-acetylated and H2A.Z-substituted histone core (H2A.Z/H3K56ac) under two salt conditions (50 and 100 mM NaCl). The plus and minus signs represent the presence and absence, respectively, of the modification (H3K56ac) or variation (H2A.Z).
