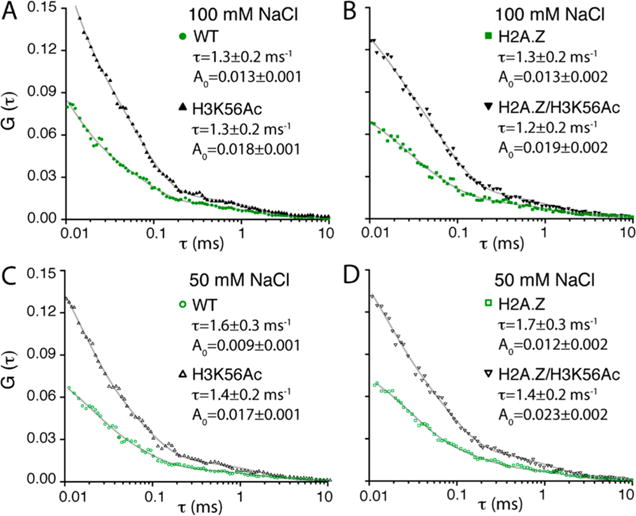
Figure 3.

Fluorescence correlation spectroscopy (FCS) reveals the effects of H3K56ac and H2A.Z on the histone core dynamics. (A–D) FCS spectra of ATTO647N from the nucleosomes made with the wild-type histone core (WT), the H3K56-acetylated histone core (H3K56ac), the H2A.Z-substituted histone core (H2A.Z), and the H3K56-acetylated and H2A.Z-substituted histone core (H2A.Z/H3K56ac) under two salt conditions (50 and 100 mM NaCl). Each spectrum is fit to a triple-exponential decay function within the range of 10 μs to 10 ms. The fitting results of the slowest dynamics component are shown [decay times (τ) and amplitudes (□)]. The other components are due to the photophysical dynamics of the fluorophores and listed in Table S1.
