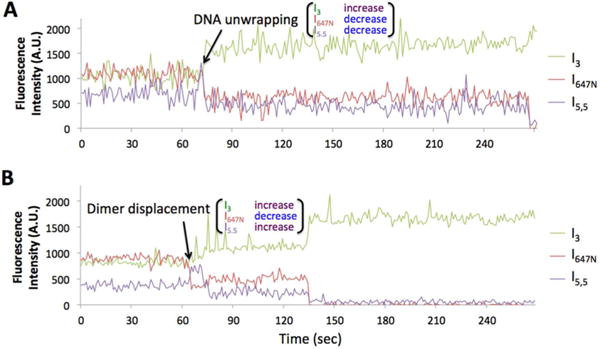
Figure 2.

Representative time traces of fluorescence intensities during the early steps of dimer dissociation (A.U. = arbitrary unit). More traces are shown in Figure S4. (A) DNA unwrapping initiates dimer dissociation as characterized by simultaneously decreasing I5.5 and I647N with increasing I3. This trace is from the wild type nucleosome under the high salt condition. The acceptor fluocesnce signals are eventually extingiuished at the end of the time trace by either dimer dissociation or photobleaching within 1−2 frames at ~270 s. (B) Dimer displacement initiates dissociation as characterized by increasing I5.5 and simultaneously decreasing I647N and increasing I3. This trace is from the wild type nucleosome under the Nap1 condition. The increased donor intensity and the decreased acceptor intensities at 135 s are due to either Atto647N photobleaching or dimer dissociation.
