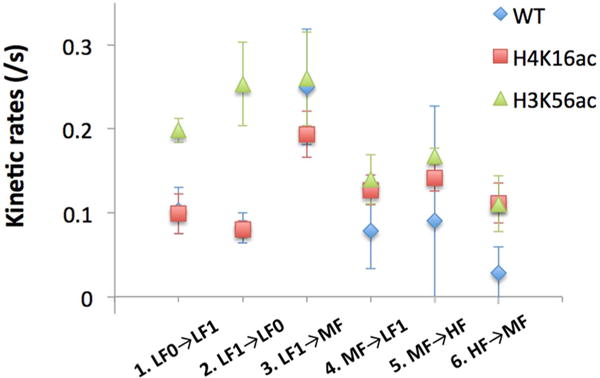
Figure 4.

Kinetic rates between two adjacent states in the four FRET states analyzed by hidden Markov models. WT denotes wild-type, or no acetylation. Acetylations at H4K16 (H4K16ac) and H3K56 (H3K56ac) increase the kinetic rate from High to Mid FRET. H3K56 acetylation facilitates the DNA fluctuations between the Low1 and Low0 FRET states. The errors are the standard deviations obtained from five HMM analyses per case (see Materials and Methods). The rates and errors are listed in Table 3.
