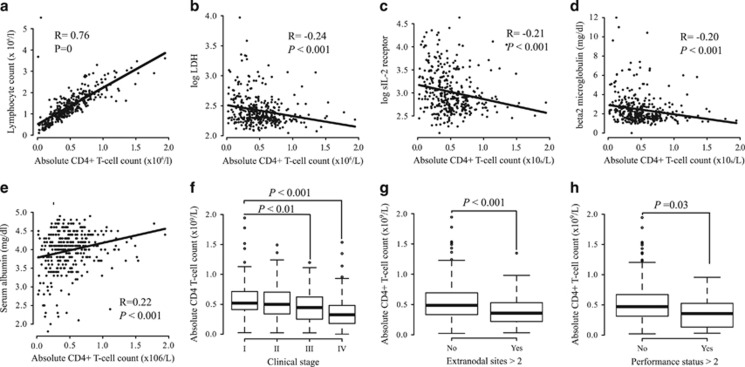
Figure 3.
Correlations between the ACD4C and poor prognostic factors. (a) A strong correlation was identified between ALC and ACD4C (Pearson's R-value 0.76, P=0). (b–d) Negative correlations were identified between the ACD4C and the log-normal distribution of the LDH level (log10 LDH), log-normal distribution of the soluble IL-2 receptor level (log10 sIL-2 receptor) and β2-microglobulin level. Pearson's R-values were −0.24 (P<0.001), −2.0 (P<0.001), −2.1 (P<0.001) and −2.2 (P<0.001), respectively, for these variables. (e) The ACD4C decreased in proportion to the albumin level. (f–h) Box plot analysis revealed significant negative correlations of the ACD4C with the Ann Arbor stage (P<0.001), extranodal disease involvement (P<0.001) and PS (P=0.03).

