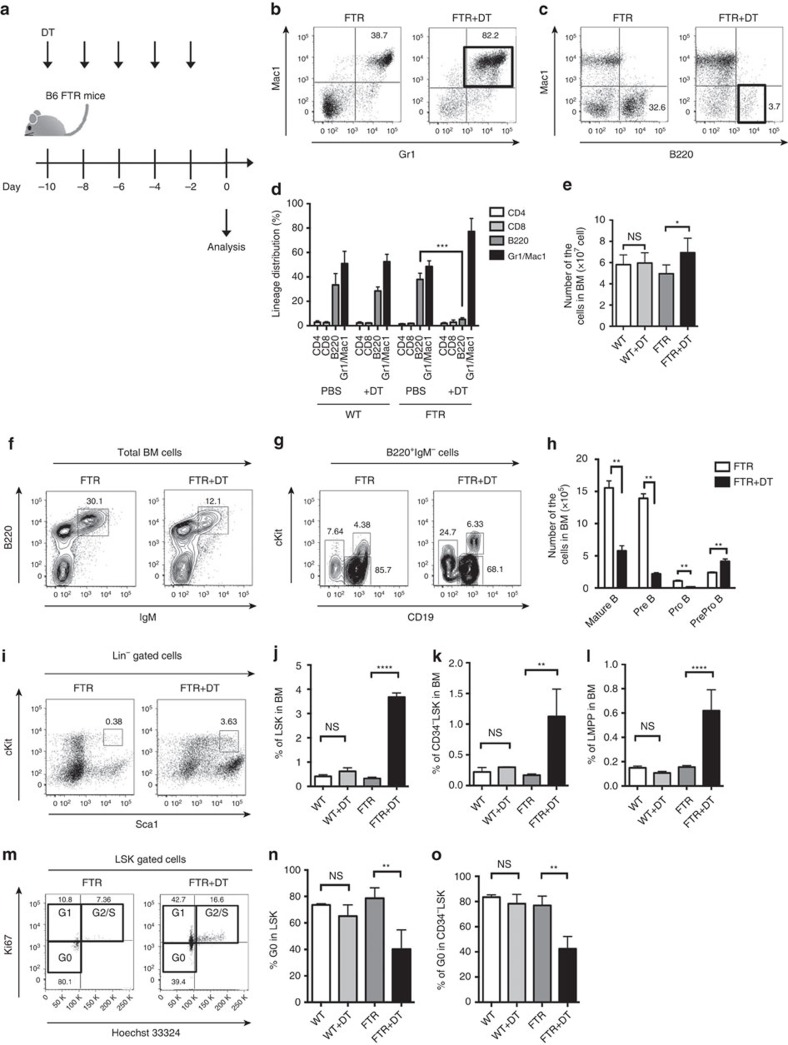
Figure 1. Treg depletion impairs B-cell differentiation in BM.
(a) Experimental scheme. (b,c) The gating strategy and representative FACS data of total BM cells from FTR mice with or without DT treatment. Note that the frequencies of Gr1+Mac1+ cells were significantly increased in DT-treated FTR mice (b) and B220+ cells were decreased (c). (d) Frequencies of CD4+ T cells, CD8+ T cells, B220+ B cells and Gr1+Mac1+ cells in BM from WT/FTR mice with or without DT treatment (n=4). Data are shown as mean±s.d. (e) Absolute number of total BM cells in WT/FTR mice with or without DT treatment. ***P<0.001, Student's t-test. Data are shown as means±s.d. (f,g) Representative results of B-cell progenitor analysis in BM from FTR mice with or without DT treatment. Typical plots of IgM+B220+ mature B cells (f), IgM−B220+CD19+cKit− Pre-B cells, and IgM−B220+CD19+cKit+ Pro-B cells are shown (g). (h) The graph shows the total number of B-cell progenitors in BM derived from the FTR mice with or without DT treatment (n=5, **P<0.01, Student's t-test). Data are shown as means±s.d. (i) Representative results of HSC analysis in BM from FTR mice with or without DT treatment. Note the significant increase of LSK population and CD34−LSK population in FTR mice with DT treatment. (j–l), Frequencies of LSK (j), HSC (CD34−LSK; (k)), and LMPP (Flt3+LSK; (l)) in BM (n=4 in each group, **P<0.01, ****P<0.0001, Student's t-test) are also shown. Data are shown as means±s.d. (m–o) The cell cycle status in HSCs derived from FTR mice with or without DT treatment is reported. Representative dot plot data (m), frequencies of G0 state in LSK (n) and in CD34−LSK (o) are shown (n=4 in total, **P<0.01, Student's t-test). Data are shown as means±s.d.

