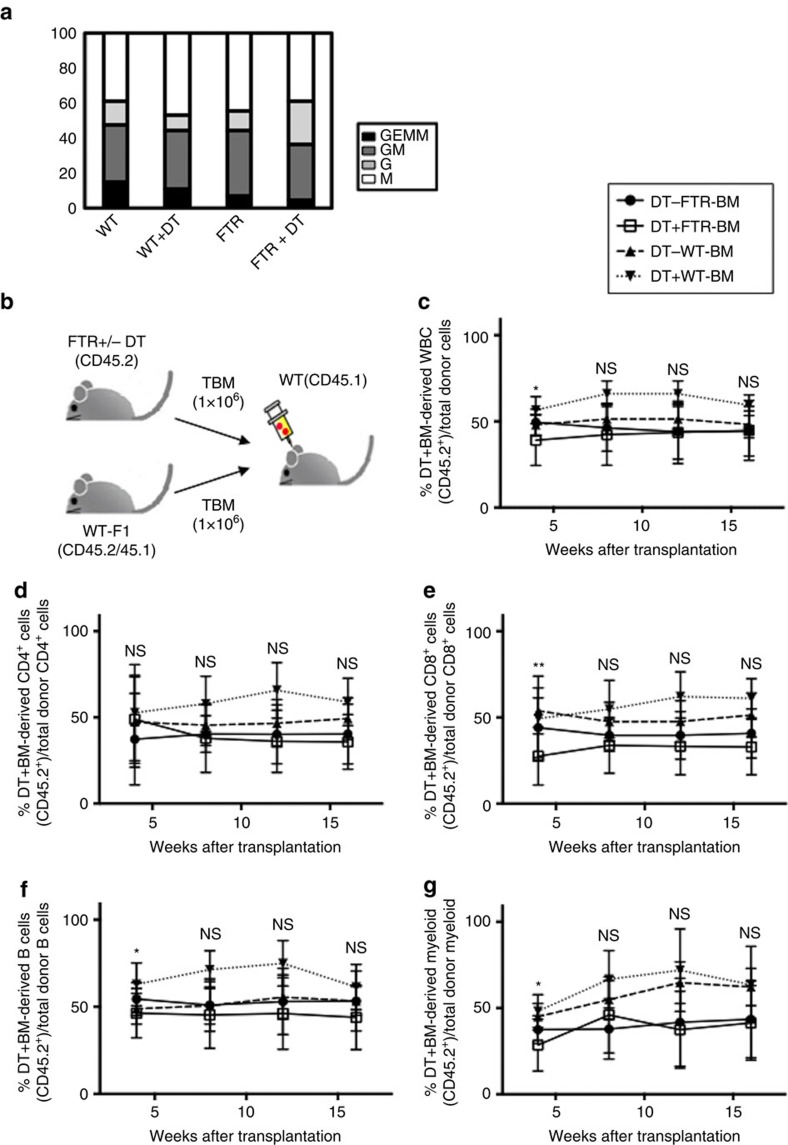
Figure 2. Normal BM environment rescues B cell defect.
(a) Results of methylcellulose colony assay using total BM cells from Treg-depleted or not FTR mice are shown. Colony distribution is reported. GEMM; granulocyte, erythrocyte, macrophage, GM; granulocyte, monocytes, G; granulocyte, M macrophage. Pooled data from three consecutive experiments are shown. (b) Experimental scheme of competitive repopulation assay using 1 × 10⁶ total BM cells from FTR mice (CD45.2) with or without DT treatment. As competitor cells, the same number of total BM cells from WT-F1 B6 mice (CD45.1/CD45.2) was co-injected into lethally irradiated CD45.1 B6 mice. (c–g) The frequencies of CD45+ (c), CD4+ T cells (d), CD8+ T cells (e), B220+ B cells (f), Gr1+Mac1+ granulocytes (g) derived from FTR mice at 4, 8, 12, 16 weeks after transplant are reported. ns=not significant, DT-FTR-BM versus DT+FTR-BM on 4 weeks after transplant in (c), (f), (g); *P<0.05, Student's t-test, DT-FTR-BM versus DT+FTR-BM on 4 weeks after transplant in (e). **P<0.01, Student's t-test. Data are shown as means±s.d.

