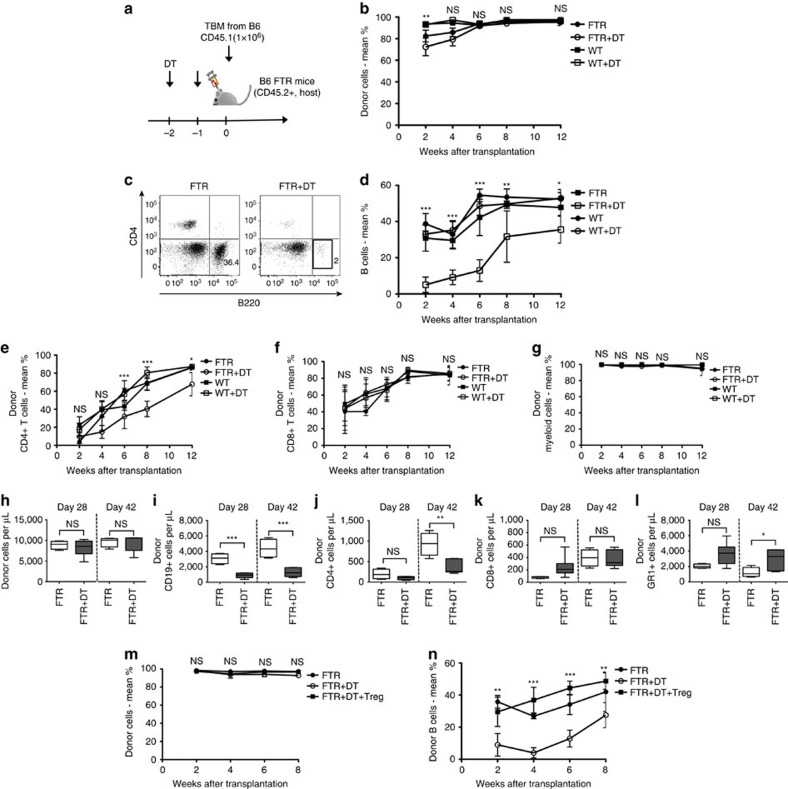
Figure 3. Host-Treg depletion delays donor B cell reconstitution.
(a) Experimental scheme: FTR mice (CD45.2) with or without DT treatment on Day -2 and -1 were lethally irradiated and transplanted with 1 × 10⁶ total BM cells from congenic CD45.1+ B6 mice. (b) Graph of PB donor chimerism of total CD45+ cells over time after transplantation of DT-treated and untreated FTR mice. (c) Representative data of CD4+ T cells and B220+ B cells in PB at day 28 after transplantation from Treg-depleted (right) or not (left) mice. (d) PB donor B cell percentage over time after transplantation of DT-treated and untreated FTR mice. (e–g). PB donor chimerism of (e) CD4+ T cells, (f) CD8+ T cells, and (g) myeloid cells over time after transplantation of DT-treated and untreated FTR mice. (h–l). Absolute number at day 28 and day 42 after transplantation of (h) total CD45+ cells, (i) B cells, (j) CD4+ T cells, (k) CD8+ T cells and (l) myeloid cells. (m,n) Total CD45+ cell donor chimerism (m) and donor B cell percentage (n) in PB of untreated FTR mice, DT-treated FTR mice and DT-treated FTR mice that were rescue with Treg cells infusion at day 0 of transplantation are shown. ns=not significant, *P<0.05, **P<0.01, ***P<0.001, Student's t-test. Data are shown as means±s.d.

