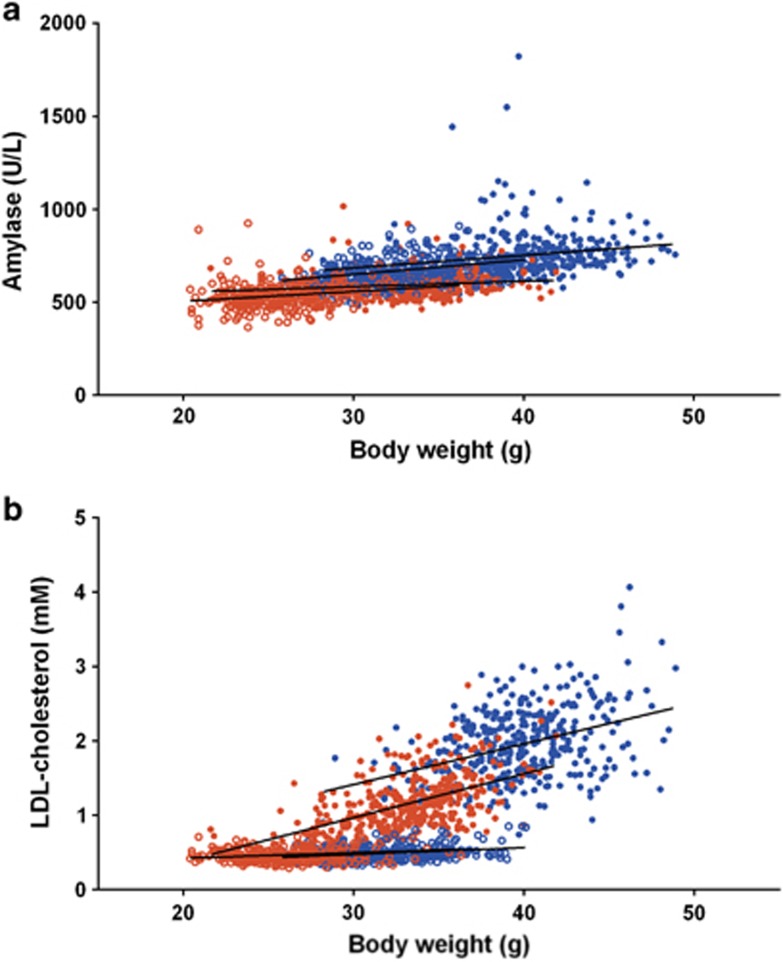
Figure 3.
Example relationship between body weight and phenotypic trait of interest. The relationship between body weight and selected phenotypes observed for B6N mice from the high-throughput phenotyping project at the WTSI. HFD data: 296 female and 290 male mice; Breeder's chow: 363 female and 370 male mice. Shown in red are female mice and blue are male mice. Closed circles represent HFD-fed mice and open circles chow-fed animals. The fitted line is a regression line. (a) Amylase; (b) LDL cholesterol. LDL, low-density lipoprotein. WTSI, Wellcome Trust Sanger Institute.

