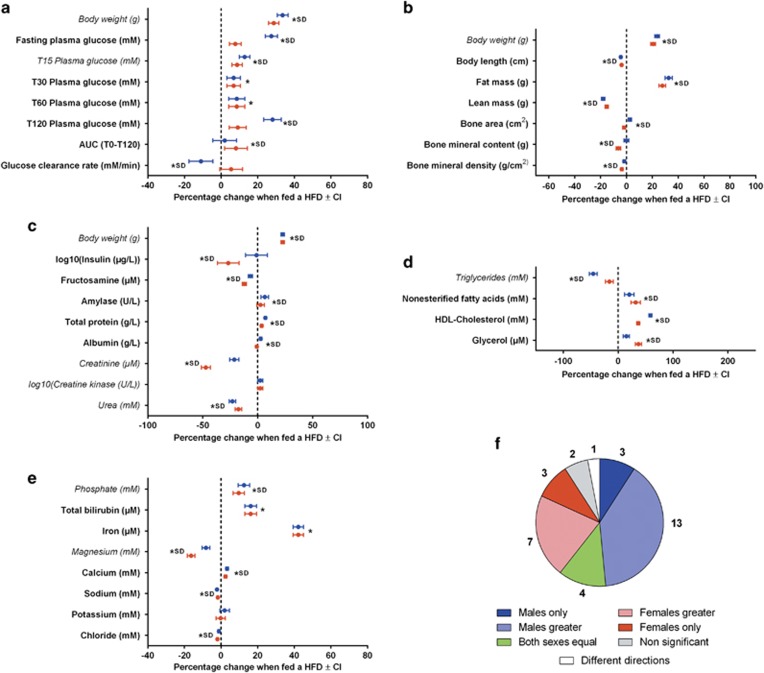
Figure 4.
The estimated effect of the HFD from fitting a weight-adjusted model and the role of sex in modifying the effect. Outputs from fitting the WAM to phenotypic data collected for B6N mice from the high-throughput phenotyping project at the WTSI (excluding the weight variables fitted with ACM model). HFD data: n=296 female and 290 male mice; Breeder's chow: n=363 female and 370 male mice. (a–d) The estimated effect of the HFD for each sex (blue for male and red for female) for each variable. The error bars indicate the 95% confidence interval. The star indicates statistical significance and SD indicates the phenotype was classed as sexually dimorphic. Variables in italics did not show a confounding relationship with body weight. The ACM effect of HFD on body weight is shown for comparison—(a) Variables associated with the ipGTT screen. (b) Body composition variables. (c) Proteins and enzyme variables. (d) Lipid variables. (e) Mineral variables. (f) The classification of how sex modified the effect of diet across all variables fitted with the weight-adjusted model. AUC, area under the curve; HDL, high-density lipoprotein; SD, sexually dimorphic; WTSI, Wellcome Trust Sanger Institute.

