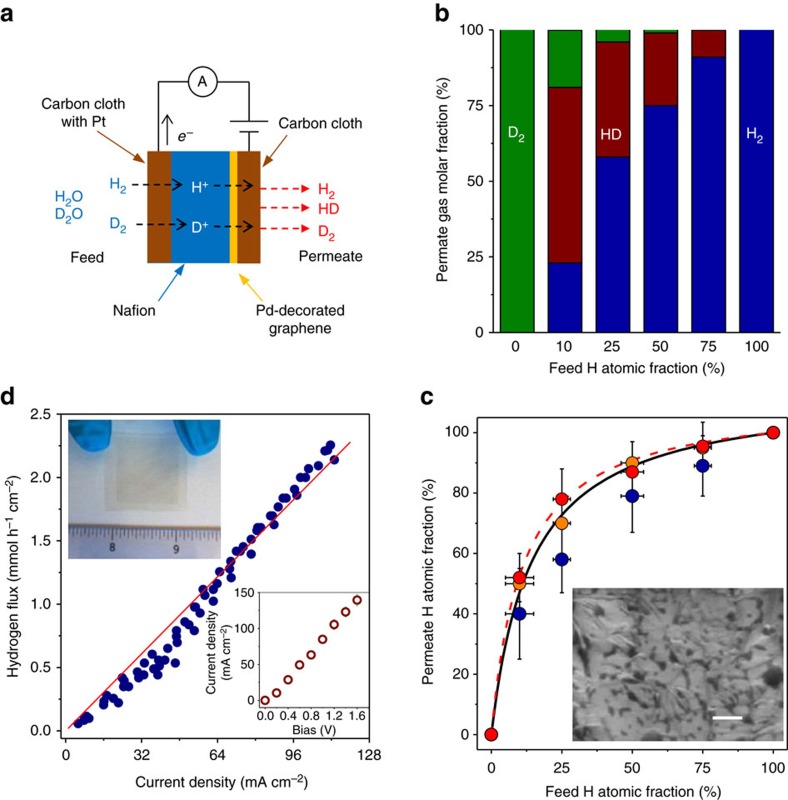
Figure 2. Characterization of isotope separation by electrochemical pumping using CVD graphene on Nafion.
(a) Schematic of our setup. (b) Gas molar fractions in the permeate, which were detected by mass spectrometry, for six different protium fractions in the feed. (c) Protium in the permeate as a function of its concentration in the feed. Symbols: different colours correspond to three devices. The red circles are for the measurements in b. Solid black and dashed red curves: equation (1) with α=8 and 10, respectively. Error bars indicate characteristic fluctuations in the protium content of both the prepared feed and the measured permeate. Inset: electron micrograph of CVD graphene on Nafion. Scale bar, 200 nm. The graphene is clearly visible as it conforms to the rough surface of the polymer, which contains areas with different (bright and dark) electron contrast. (d) H2 flux (throughput per unit area) as a function of electric current for one of our devices with only protium in the feed. The red line is the best fit that agrees with Faraday's law within the experimental scatter. Top inset: photo of a graphene-on-Nafion membrane without carbon cloth. Graphene shows up as a darker area. Bottom inset: typical current-voltage characteristic for our devices.

