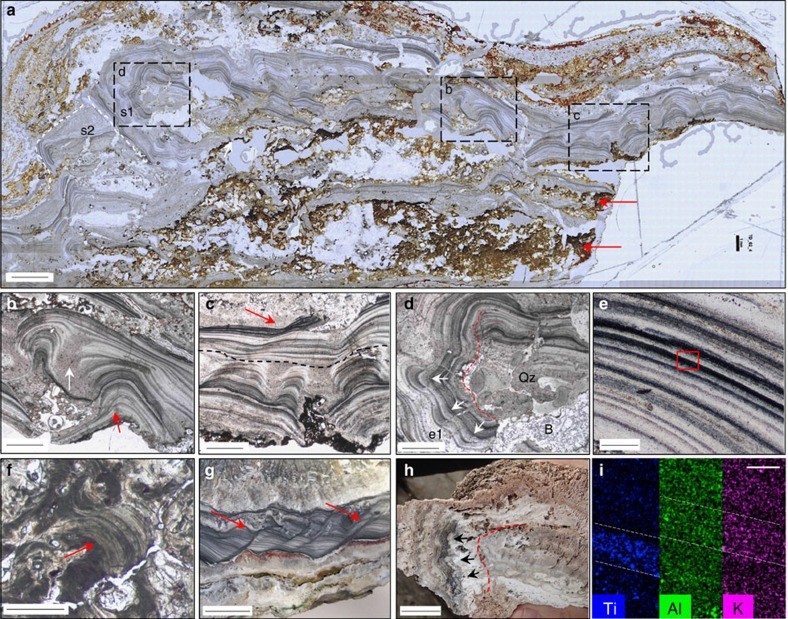
Figure 1. Comparison of Dresser geyserite with modern examples.
Scale bar measurements indicated. (a) High resolution gigapan image of Dresser geyserite. Inset boxes are figure parts (b,c,d). Laminae overgrowth stages; s1 and s2 represented by white dashed lines. Ferruginous material (red arrows) contains inferred gas bubbles; see Fig. 5. Scale bar, 2 mm. Micrographs in PPL (b–f). (b) Botryoidal textures display laminae onlap/offlap (red arrow), separated by siliceous equigranular troughs (white arrow) overlain by fine, planar laminae (scale bar, 1 mm). (c) Botryoidal–columnar textures overlain by planar (black dashes), slumped (red arrow) laminae. Scale bar, 1 mm. (d) Overgrowth (e1) with outward and downward facing botryoids (white arrows). Quartz (Qz) and barite (B), infill and cross-cut laminae (scale bar, 1 mm). (e) Close-up of light/dark microlaminae in Dresser geyserite. Inset box of figure part (i). Scale bar, 50 μm. (f) Modern geyserite with botryoidal microlaminae (red arrow), Geysir, Iceland. Analogous to (b). Scale bar, 1 mm. (g) Slumped laminae of <100-year-old geyserite, Geyser Valley, New Zealand. Analogous to c. Scale bar, 1 cm. (h) Pool rim overgrowth of geyserite with outward facing botryoids (arrows), Geyser Valley, New Zealand. Analogous to d. Scale bar, 2 cm. (i) SEM-EDS element maps showing light bands enriched in K–Al alternating with dark bands enriched in Ti, identified as kaolinite+illite and anatase, respectively, from Raman spectroscopy and XRD analysis; see Supplementary Figs 2–6 (scale bar, 50 μm).

