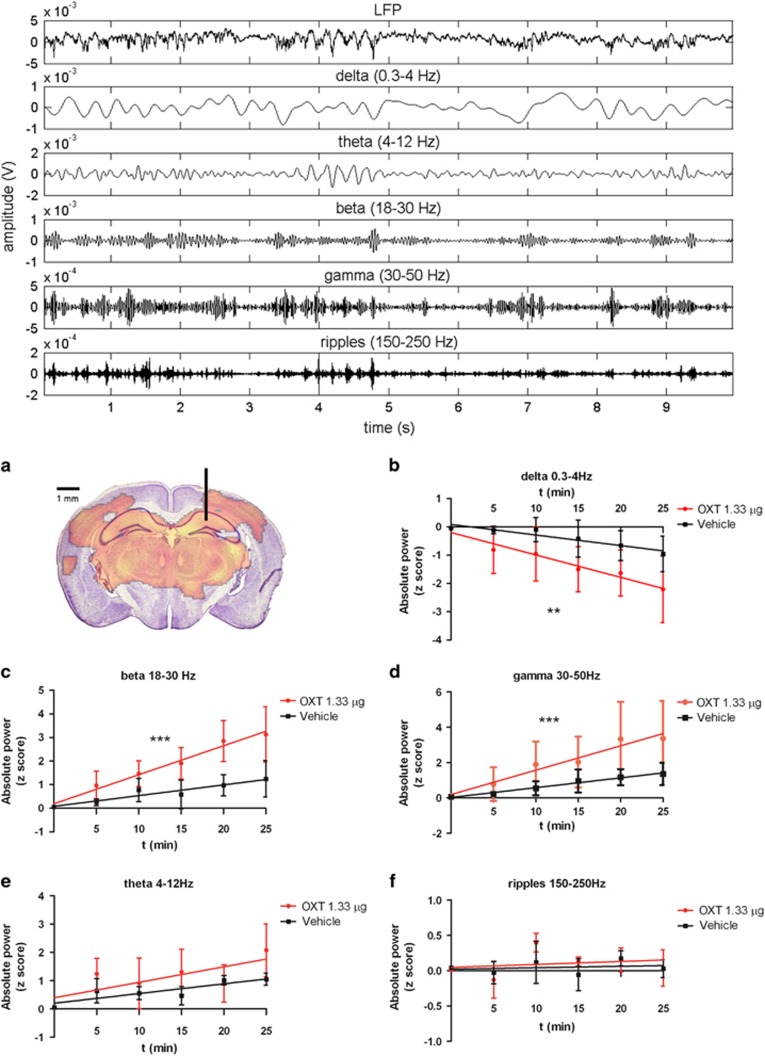
Figure 2.
Intranasal OXT induced multi-band LFP response in the dorsal hippocampus. Top: Representative LFP traces recorded 20 min after OXT administration (1.33 μg) in the dorsal hippocampus. (a) Representative coronal brain section with superimposed the fMRI response to OXT stimulation. The insertion path of the tungsten electrode used for hippocampal oscillation recordings is indicated by the vertical black line. (b–e) Time course of absolute power (Z-score) for delta (b), beta (c), gamma (d), theta (e), and ripple (f) frequency bands upon oxytocin or vehicle application. Bars indicate the SEM of individual data points. Linear regressions (solid lines) show a significant difference in absolute power change across the first 25 min for beta, delta, and gamma oscillations (**p⩽0.01, ***p⩽0.001).

