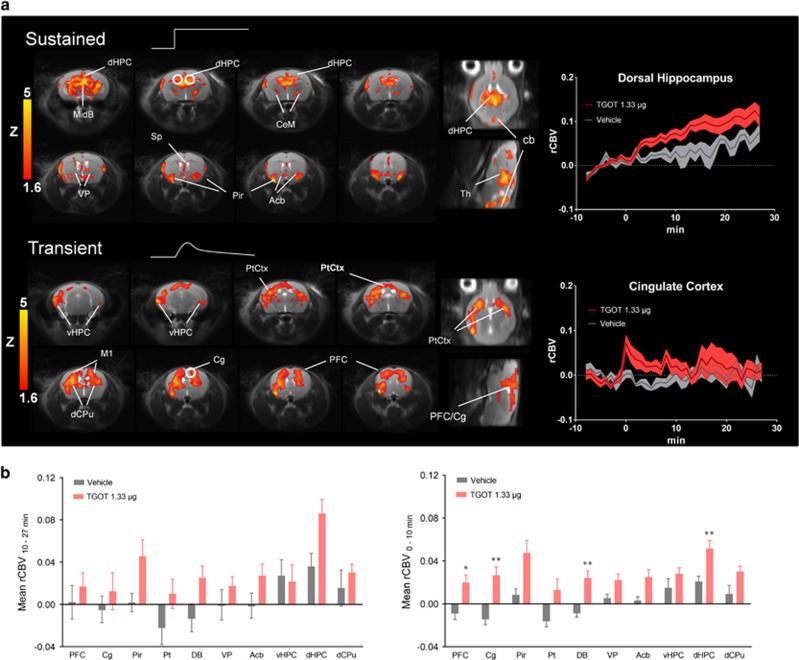
Figure 3.
fMRI activation produced by the selective OXT-R agonist TGOT in the mouse brain. As with OXT, we mapped the functional activation produced by acute intranasal TGOT areas (1.33 μg/mouse) using two different regression functions characterized by a sustained (a, top) and transient dynamics (b, bottom). The regressor functions used for fMRI mapping are depicted on top of each panel. Illustrative fMRI time courses in the representative regions of interest (identified by a circle in the activation maps) are also reported. TGOT or vehicle were administered at time 0. Data are plotted as mean±SEM within each group. (b) Mean rCBV response elicited by TGOT as quantified in the representative regions of interest (*p<0.05; **p<0.01, Student's t-test, followed by Benjamini–Hochberg correction). Acb, nucleus accumbens; cb, cerebellum; Cg, cingulate cortex; DB, diagonal band; dCPu, dorsal portion of the caudate putamen; dHPC, dorsal hippocampus; Pt, parietal cortex; PFC, prefrontal cortex; Pir, piriform cortex; rCBV, relative cerebral blood volume; vHPC, ventral hippocampus; VP, ventral pallidum.

