Figure 5.
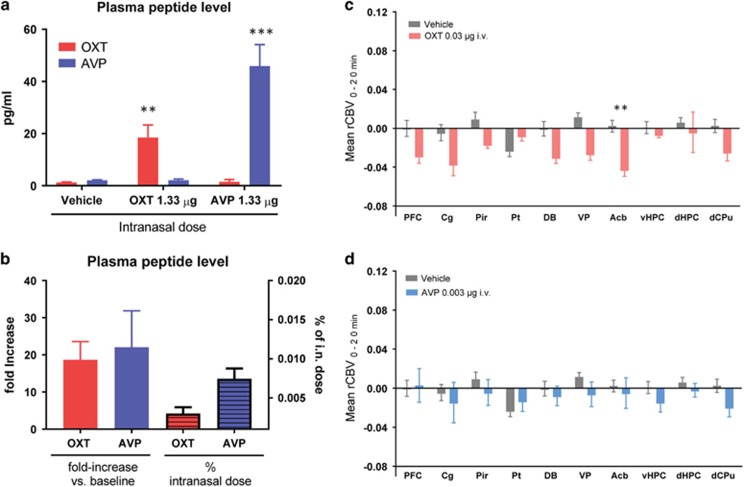
Plasma peptide measurements and intravenous fMRI mapping. (a) Plasma OXT and AVP levels (pg/ml) 25 min after intranasal oxytocin or vasopressin administration (1.33 μg/mouse). Data are expressed as mean±SEM within each group. **p<0.01, ***p<0.001 Student's t-test, vs, vehicle). (b) Plasma OXT and AVP levels expressed as fold increase compared with mean baseline levels (left panel) or as percentage with respect to the administered intranasal dose (right panel). (c) Mean rCBV response elicited by intravenous administration of OXT (0.03 μg/mouse) as quantified in representative volumes of interest. The response to OXT was significantly reduced compared with vehicle only in the nucleus accumbens (Acb) VOIs (**p<0.01, Student's t-test, followed by Benjamini–Hochberg correction). (d) Mean rCBV response elicited by intravenous administration of AVP (0.003 μg/mouse) as quantified in the representative volumes of interest. Data are plotted as mean±SEM within each group. Acb, nucleus accumbens; Cg, cingulate cortex; DB, diagonal band; dCPu, dorsal portion of the caudate putamen; dHPC, dorsal hippocampus; Pt, parietal cortex; PFC, prefrontal cortex; Pir, piriform cortex; rCBV, relative cerebral blood volume; vHPC, ventral hippocampus; VP, ventral pallidum.

