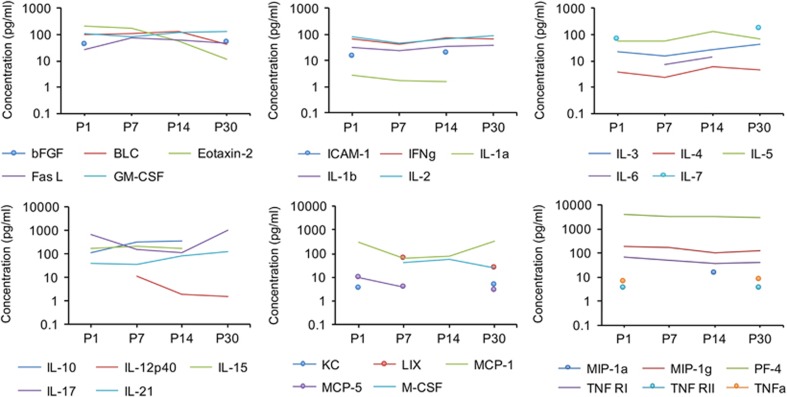
Figure 2.
Dynamic expression of cytokines and chemokines in the cerebellum throughout normal development. To illustrate changes in cytokine concentrations with age, the average values for each cytokine concentration in pg/ml of cerebellar lysate are plotted at the four ages examined. Values of mean±SEM concentration are included in Supplementary Table 1.

