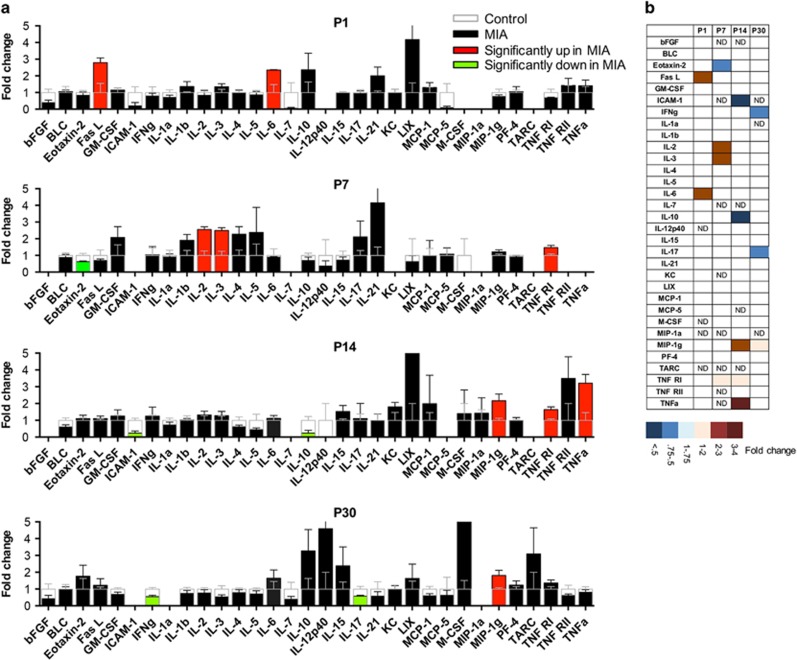
Figure 3.
(a) MIA induces long lasting changes in cerebellar cytokines throughout development. Multiplex array showing the differential expression of various immune molecules in the cerebellar lysates of MIA offspring compared to control values at different stages of development. The average fold-change and SEM in cytokine concentration in cerebellum from MIA offspring compared to control values is plotted. Values from MIA offspring are either black, red, or green, and the control values are superimposed in clear bars. Red and green bars indicate statistically significant increases or decreases, respectively, compared to controls (P<0.05). Increases are shown above 1 and decreases, below 1. Values of fold change and SEMs are included in Supplementary Table 2. (b) A heat map is used to summarize the results for MIA-induced changes in cytokines and chemokines. The degree of change is indicated by the depth of color as indicated in the lower panel. ND = below the level of detection.

