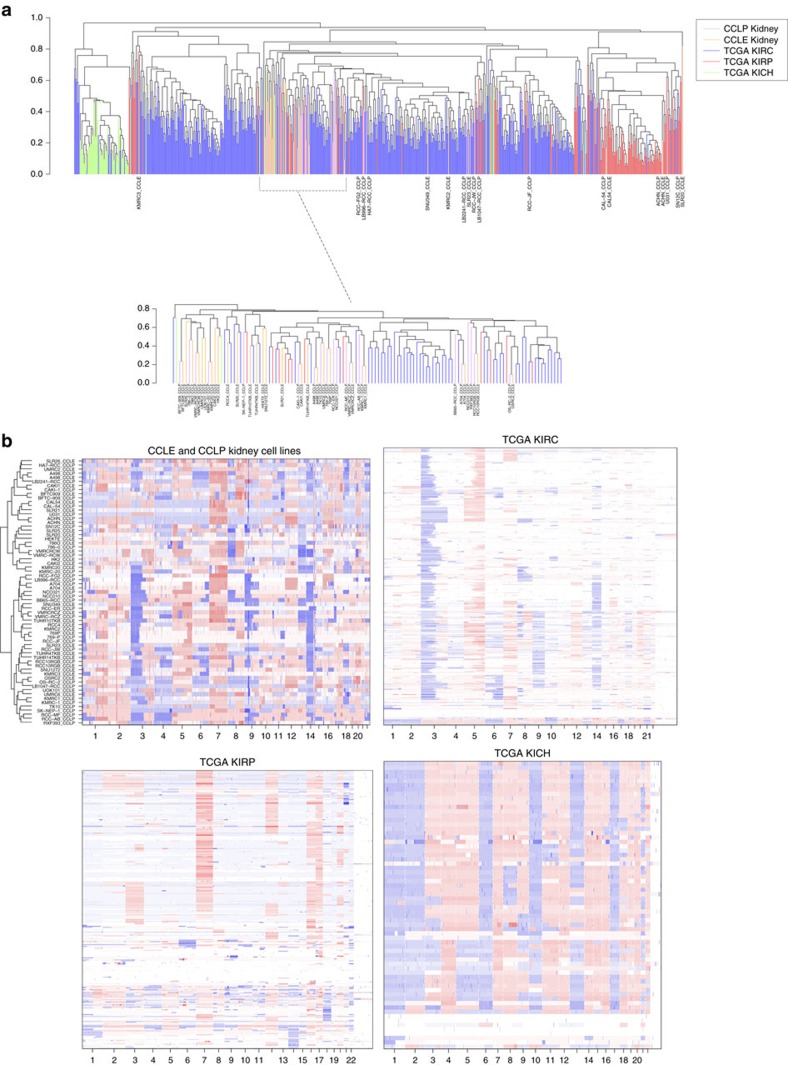
Figure 2. Clustering RCC cell lines and tumours by CNAs into RCC subtypes.
(a) CNA-based clustering of 32 CCLP and 33 CCLE kidney cell lines and 728 TCGA kidney tumours (504 KIRC or clear cell, 158 KIRP or papillary and 66 KICH or chromophobe). Tumours clearly separate by subtype and the majority of cell lines cluster with clear cell renal tumours. No cell lines cluster with chromophobe tumours, but 3, ACHN, U031 and CAL54, cluster with papillary tumours. Two cell lines—SN12C and SLR21–are outliers and cluster away from all other tumours and cell lines on their own. (b) CNA landscape of CCLE and CCLP kidney cell lines–most of the clear cell renal cell lines show the characteristic 3p loss and VHL mutations (refer to Fig. 3), while several show other characteristic CNAs. ACHN, U031 and CAL54 show characteristic pRCC alterations, while SN12C and SLR21 are unlike any of the tumour subtypes. Cell lines are ordered according to the clustering in a, so cell lines with shared alterations are together. The CNA landscapes of the TCGA KIRC, KIRP and KICH data sets are also shown for comparison.

