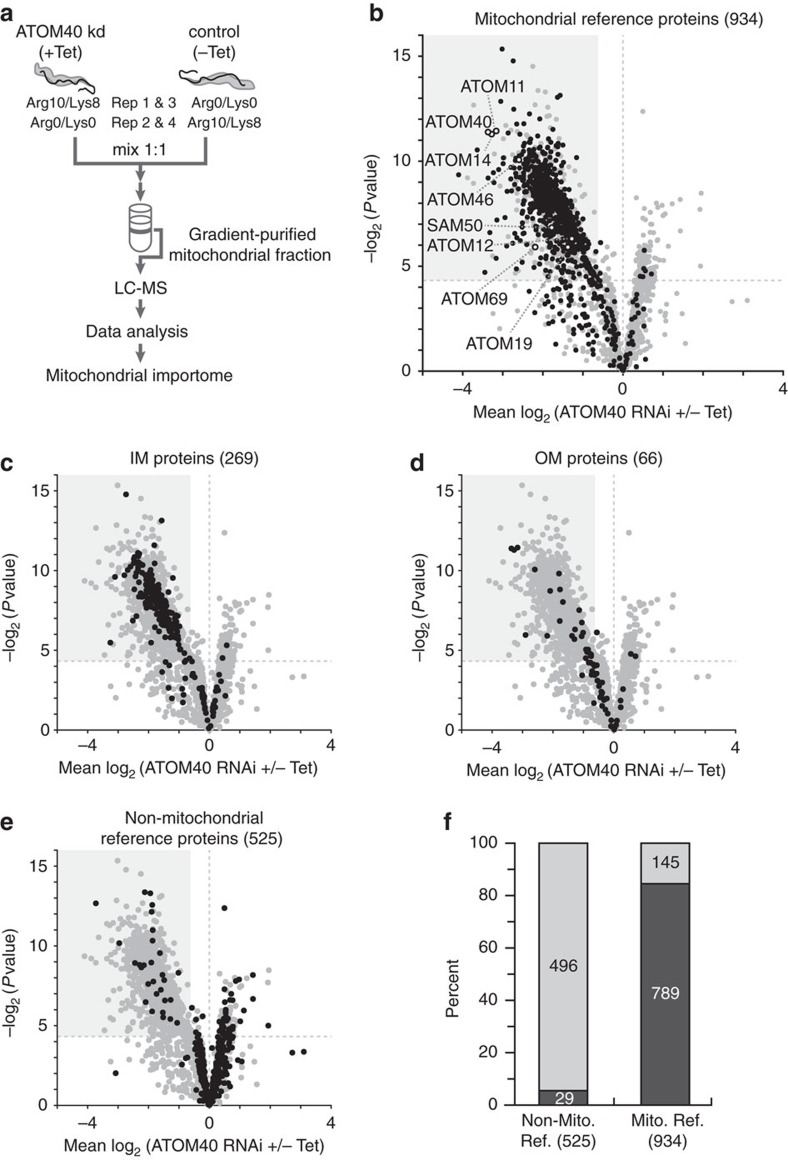
Figure 2. Delineation of the ATOM40-dependent mitochondrial importome.
(a) General workflow to study the mitochondrial importome. Using stable isotope labelling by amino acid in cell culture (SILAC), procyclic ATOM40-RNAi cells were differentially labelled with heavy arginine (Arg10) and lysine (Lys8) or their light counterparts (Arg0/Lys0). Tetracycline-induced (+Tet) and uninduced (−Tet) ATOM40-RNAi cells were mixed at day 3 after induction and mitochondria were purified by differential and Nycodenz density gradient centrifugation (n=4). Mitochondria were analysed using a gel-based LC-MS approach followed by computational data analysis to establish the mitochondrial importome. (b) SILAC-RNAi data obtained in a were visualized in a volcano plot. Proteins with a P value <0.05 (n=4) and a mean log2 ratio of less than or equal to −0.62 were considered significantly decreased in abundance (shaded area) and represent the here established mitochondrial importome. Subunits of the ATOM complex and the β-barrel protein SAM50 are annotated. Mitochondrial reference proteins (934) are depicted in black, others (1,442) in grey. (c–e) Volcano plot shown in b with different classes of proteins highlighted in black as indicated. For details about mitochondrial inner membrane (IM) and outer membrane (OM) proteins as well as the definition of non-mitochondrial reference proteins, see ‘Methods' and Supplementary Data 1 and 2. (f) Distribution of 525 non-mitochondrial reference proteins and 934 mitochondrial reference proteins quantified in gradient-purified mitochondrial fractions. For each reference set, the portion of proteins that are part of the mitochondrial importome (mean log2 ratio less than or equal to −0.62, P value <0.05, n=4) is depicted in dark grey, while the fraction of proteins that do not belong to the importome is depicted in light grey.

