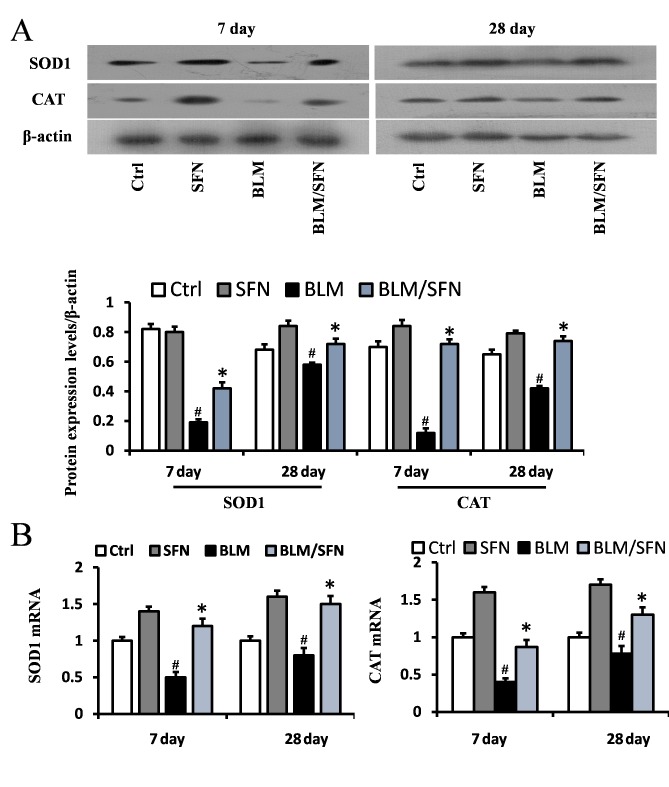
Figure 7.
Effects of SFN on the protein and gene expressions of SOD1 and CAT in BLM-induced models. (A) Western blot analysis for SOD1 and CAT was used to investigate the effect of SFN on BLM-induced models at days 7 and 28 post-treatment. BLM reduced the protein levels of SOD1 and CAT at day 7 and 28, and this was reversed following SFN treatment. (B) Quantification of mRNA expression levels of SOD1 and CAT in BLM induced lung tissues at day 7 and 28 post-treatment, as detected by reverse transcription-quantitative polymerase chain reaction. Data are presented as the mean ± standard deviation (n=6/group). #P<0.05 vs. control group; *P<0.05 vs. BLM group. SOD1, superoxide dismutase 1; CAT, catalase; BLM, bleomycin; SFN, sulforaphane; Ctrl, control.

