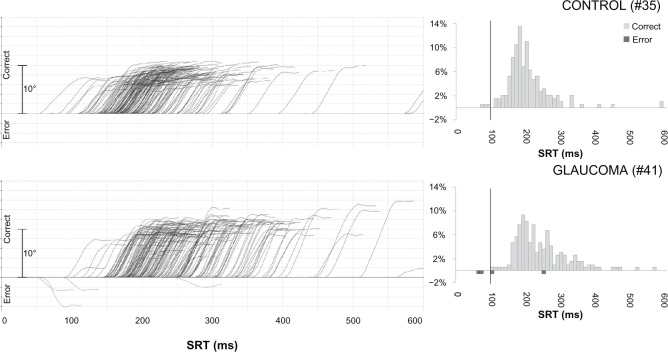
Figure 1.
Traces of individual saccades for two subjects (left) and histograms of corresponding reaction times (right).a
Notes: aThe left column shows eye position (in degrees) as a function of time (in ms) after the onset of the stimulus. Traces above the x-axis show saccades made in the correct direction for the stimulus, whereas those below show direction errors. Each curve represents a single saccade. The right column shows histograms of reaction times for the two subjects (percentage of total responses on the y-axis, saccade reaction times [SRT] in ms on the x-axis). Light bars above the x-axis represent saccades made in the correct direction, whereas dark bars below the x-axis represent direction error. Data points to the left of the bolded vertical line represent express saccades (saccade reaction times < 100 ms).

