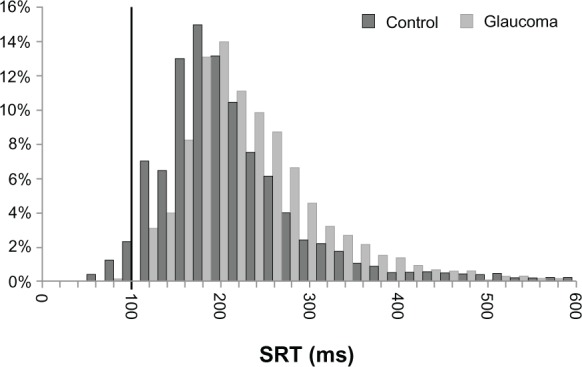
Figure 2.

Saccade reaction times (SRT).a
Notes: aHistogram shows the distribution of SRT for each group (percentage of total responses on the y-axis, and in ms on the x-axis). Dark bars represent data from control subjects; light bars represent data from glaucoma patients. Data points to the left of the bolded vertical line at 100 ms represent express saccades.
