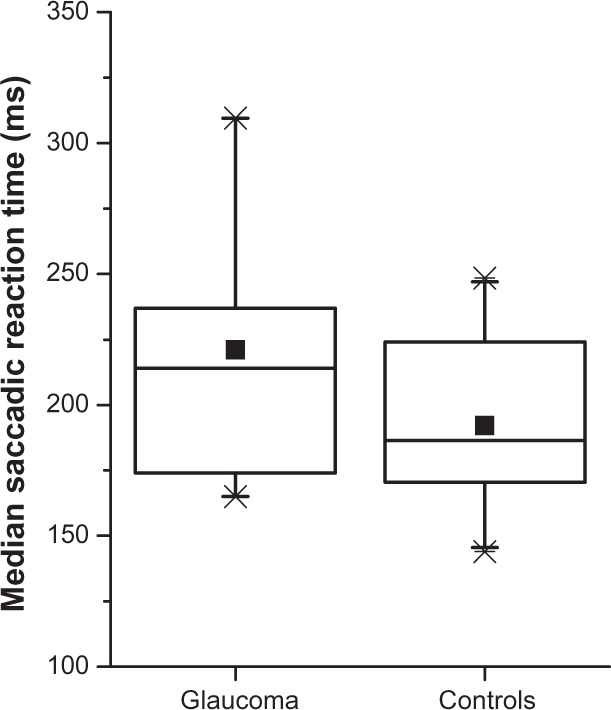
Figure 3.

Box plots of median saccade reaction times per group.a
Notes: aThe horizontal bars across the boxes are the medians of the groups; small squares indicate group means. The boxes themselves delineate the 25th percentile to the 75th percentile of each group, the “whiskers” indicate the 5th and 95th percentiles, and the “X”s mark minima and maxima.
