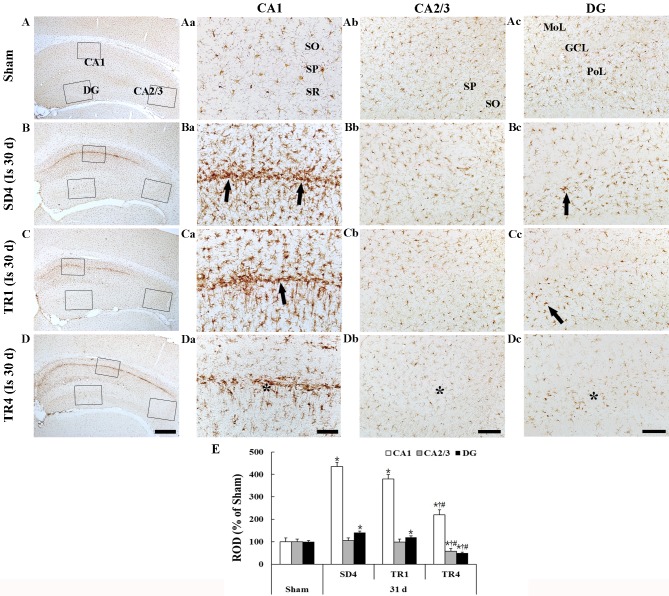
Figure 4.
Iba-1 immunohistochemistry in the (A) sham, (B) SD4, (C) TR1 and (D) TR4 groups. Iba-1-immunoreactive microglia were activated (arrows) in the CA1 region and the PoL of the DG in the SD4 group. In the TR4 group, the activation of Iba-1-immunoreactive microglia was significantly decreased (asterisks) although the activation in the TR1 group was similar to the SD4 group. Scale bar: (Aa-Da) 400 µm, (Ab-Db) 40 µm and (Ac-Dc and Ad-Dd) 100 µm. (E) ROD expressed as a percentage of Iba-1 immunoreactive structures (n=7/group). Data are presented as the mean ± standard error of the mean. *P<0.05 vs. the sham group; †P<0.05 vs. the SD4 group; #P<0.05 vs. the TR1 group). Iba-1, ionized calcium binding adaptor molecule 1; SD, sedentary routine; TR, treadmill exercise; DG, dentate gyrus; GCL, granule cell layer; MoL, molecular layer; SO, stratum oriens; SP, stratum pyramidale; SR, stratum radiatum; ROD, relative optical density.

