
Figure 1.
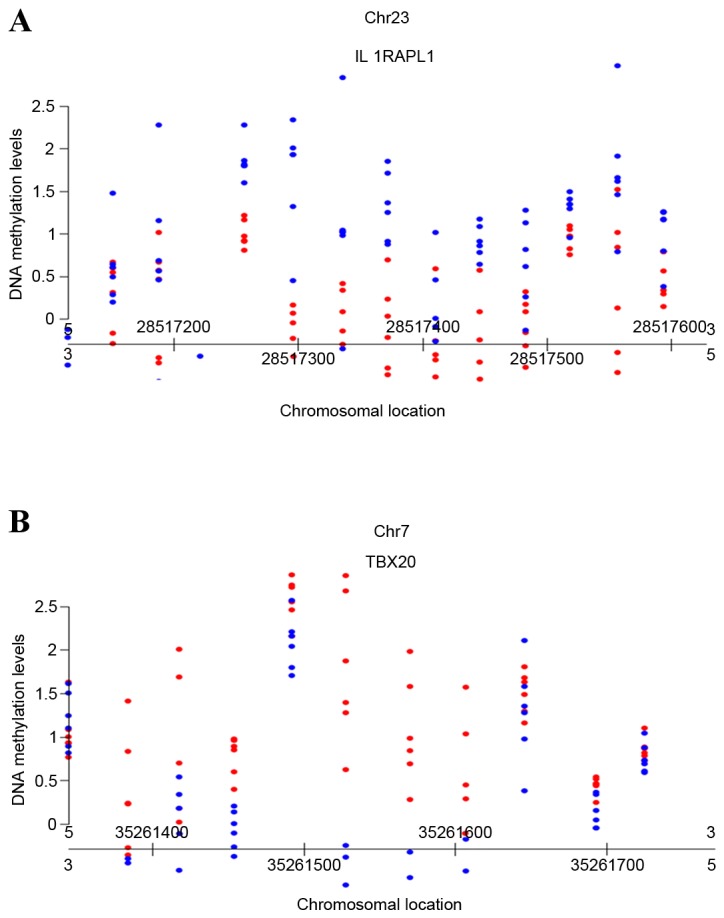
Scatter plots generated using R software packages based on the methylation degree. (A) The fetus hypomethylation region on chromosome X. (B) The fetus hypermethylation region on chromosome 7. The X axis refers to chromosomal location; the Y axis refers to the degree of the DNA methylation. Red dots refer to fetal DNA methylation CpG sites; blue dots refer to maternal DNA methylation CpG sited. CpG, C-phosphate-G.