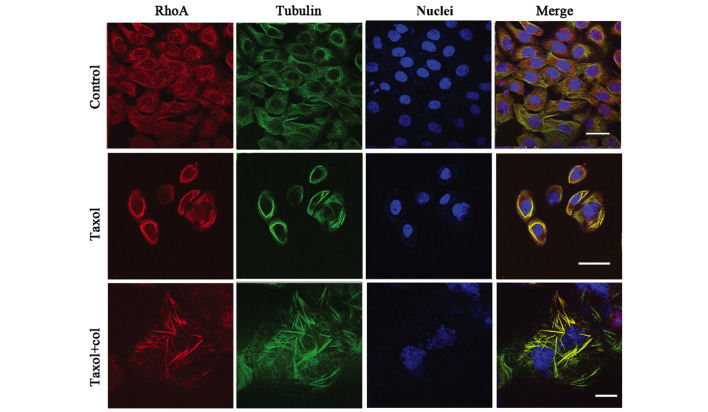
Figure 2.
Taxol treatment of cells induces MT and GTP-RhoA co-localization, as determined by immunofluorescent staining. Confocal images demonstrate cell staining of RhoA (red), MTs (green) and nuclei (blue). Scale bar=10 µm. MT, microtubule; GTP, guanosine triphosphate; RhoA, Ras homology gene family, member A.

