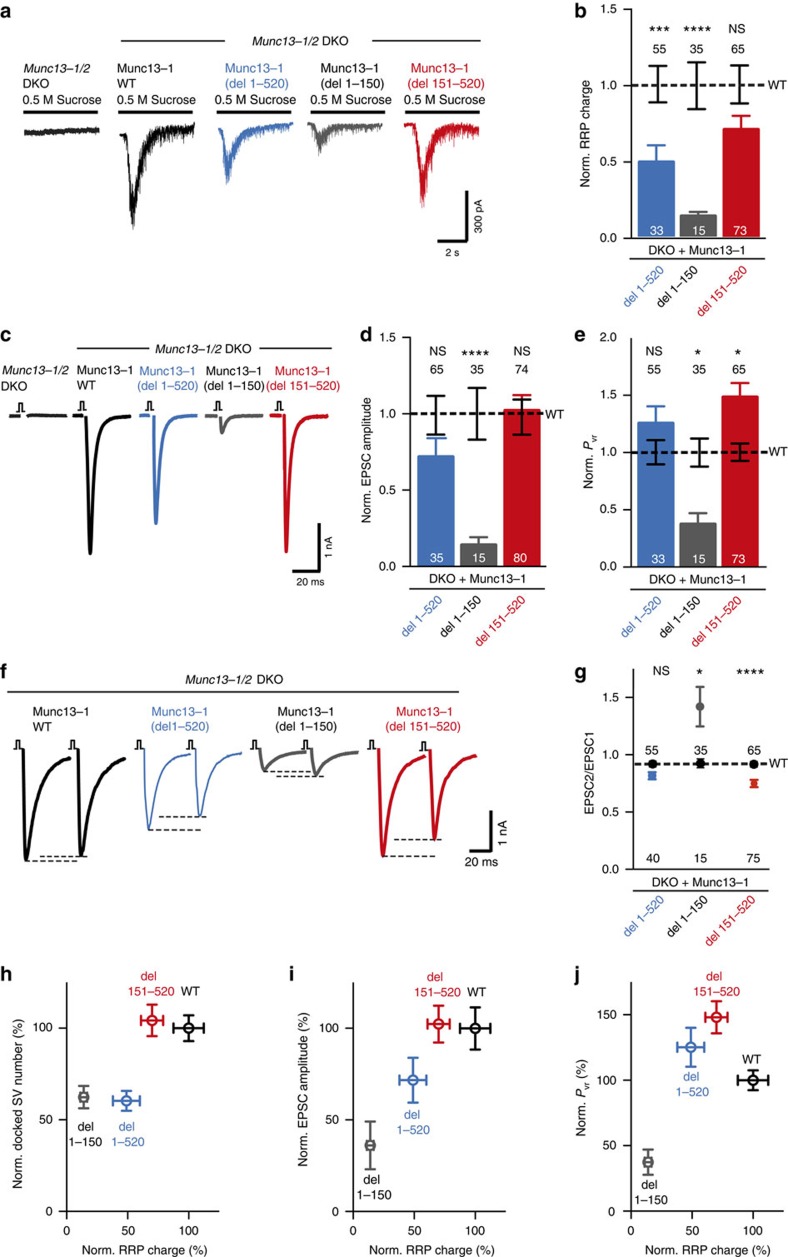
Figure 2. Impairment of RRP, EPSC and Pvr on truncation of the C2A domain in Munc13-1.
(a) Representative traces of synaptic responses induced by 500 mM sucrose from Munc13-1/2 DKO autaptic hippocampal cultures and DKO cultures rescued with the respective Munc13-1 WT and mutants indicated above. (b) Plot of RRP charge of Munc13-1 mutants normalized (Norm.) to corresponding Munc13-1 WT data. (c) Representative traces of AP-evoked EPSC amplitudes recorded in autaptic hippocampal neurons from Munc13-1/2 DKO and DKO rescued with Munc13-1 mutants indicated above. (d) Plot of AP-evoked EPSC amplitudes of Munc13-1 mutants normalized to corresponding Munc13-1 WT. (e) Plot of Pvr of Munc13-1 mutants normalized to corresponding Munc13-1 WT. (f) Example traces of EPSC amplitudes in response to 2 APs separated by 100 ms (10 Hz) of DKO rescued with Munc13-1 WT and mutants indicated above. (g) Graph showing average paired-pulse ratios calculated from the 2 AP-evoked EPSC amplitudes. WT rescue is shown as black dotted line. (h–j) Correlation between primed synaptic vesicle and docked synaptic vesicle, AP-evoked EPSC amplitudes and vesicular release probability from DKO neurons rescued with Munc13-1 WT and N-terminal deletion mutants. Numbers in plots are n values for each mutant group and numbers above the dashed line are the corresponding WT n numbers. Error bars represent s.e.m. Significances and P values were determined by one-way analysis of variance (ANOVA) with Kruskal–Wallis test followed by Dunn's post test. Values indicate mean±s.e.m.; *P<0.05; ***P<0.001; ****P<0.0001.

