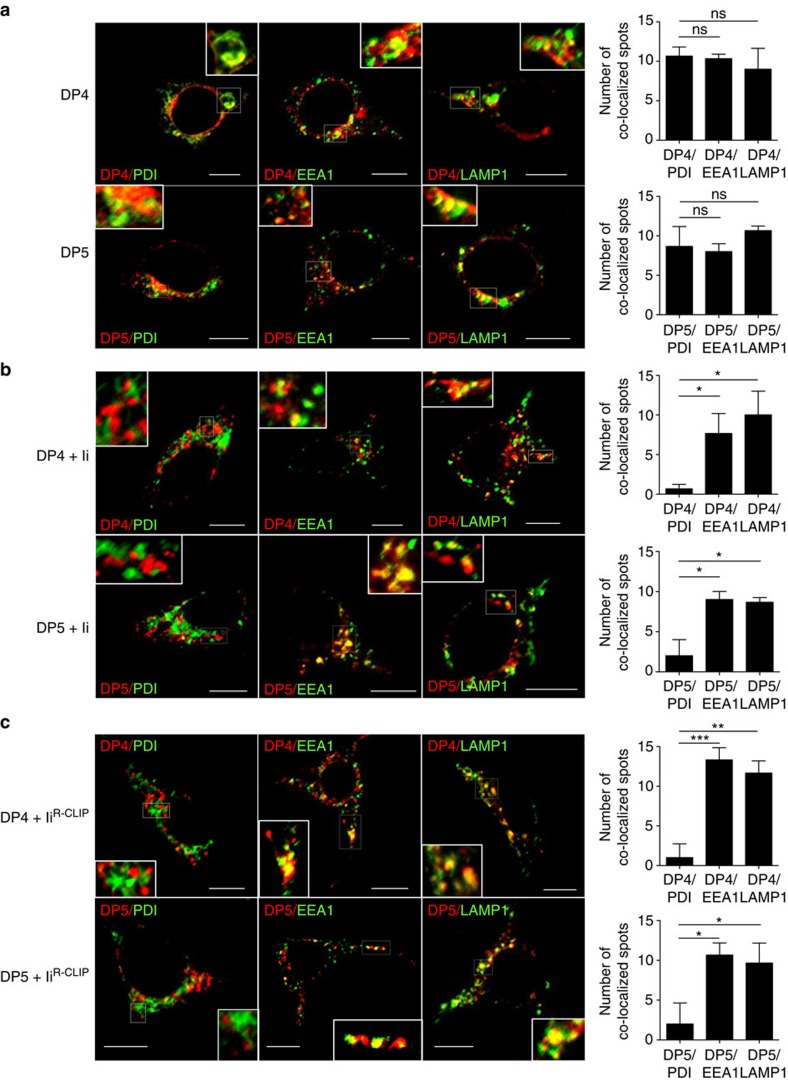
Figure 4. Subcellular localization of DP4 and DP5 in the presence or absence of Ii.
(a–c) HEK293 cells were transfected with the indicated combinations of genes. Fixed cells were permeabilized and stained for DP (red) in conjunction with an ER marker, PDI (green, left panels), an early endosomal marker, EEA1 (green, middle panels) or a late endosomal/lysosomal marker, LAMP-1 (green, right panels) and analysed by confocal microscopy. Inset boxes indicate the areas depicted at higher magnification. Scale bar in all images, 10 μm. Quantification of co-localized spots represents means±s.d. of three counted cells in each condition. ns, not significant; *P<0.05, **P<0.01, ***P<0.001 by unpaired, two-tailed Welch's t-test.

