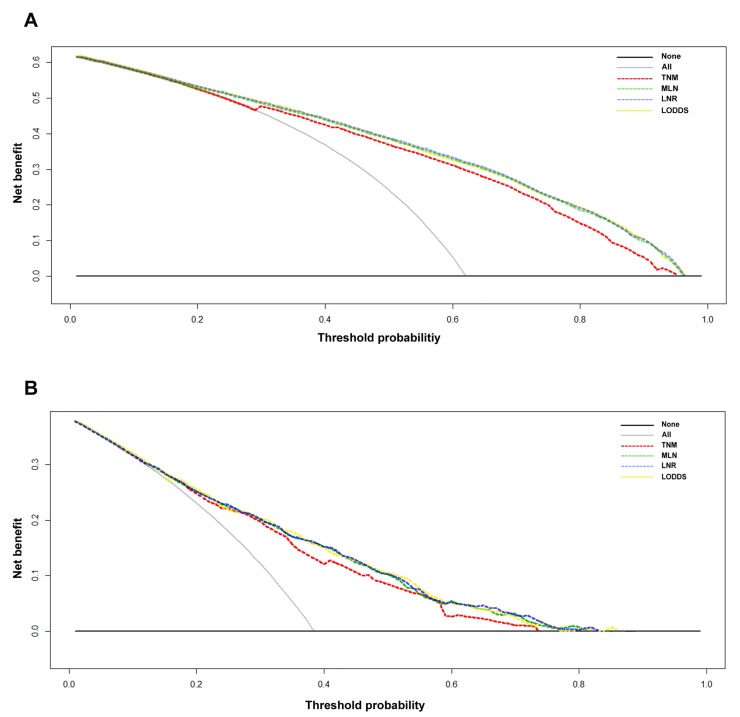
Figure 4.
Decision curve analyses of the 5-year overall survival (OS) predictions for the training set (A) and the Chinese set (B). The dashed lines indicate the net benefit of using the nomograms based on the metastatic lymph node (MLN) count (green dashed line), lymph node ratio (LNR; yellow dashed line), and log odds of metastatic lymph nodes (LODDS; blue dashed line), and the 7th TNM staging (red dashed line). The assumption that all of the patients will die is shown with a grey line, and the assumption that all of the patients will survive is indicated with a black line. Threshold probability = 1 - predicted 5-year OS.

