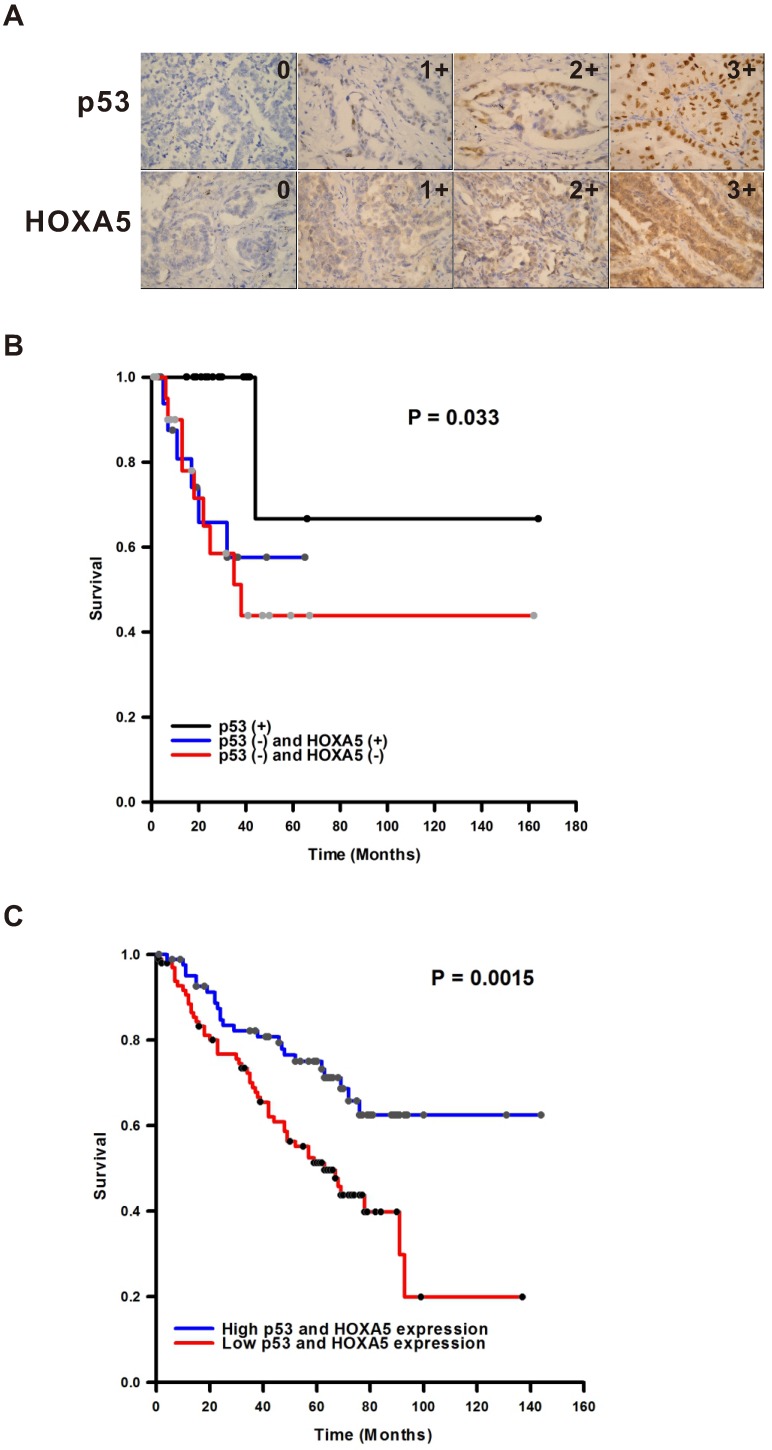
Figure 2.
The p53 and HOXA5 expression levels and clinical outcome correlations. (A) The expression intensity examples of p53 and HOXA5 in non-small cell lung cancer. The intensity is from non-expression (0) to highest expression intensity (3+). The expression location of p53 is mainly in the nuclei while HOXA5 expressed mainly in the cytoplasm. All pictures were taken in 400X. (B) Kaplan-Meier plot of overall survival by different expression status of p53 and HOXA5. p53 (+) = group with cases were immunoreactive for p53 and regardless of HOXA5 immunoexpression. p53 (-) and HOXA5 (+) = group with cases were non-immunoreactive for p53 and cytoplasmic immunoreactive for HOXA5. p53 (-) and HOXA5 (-) = group with all cases were both non-immunoreactive for p53 and HOXA5. (C) The prognostic value of p53 and HOXA5 expressions in lung cancer patients (GSE50081 cohort; n=181). The desired Affymetrix ID is valid: 201746_at (p53) and 213844_at (HOXA5). Data was analyzed by using Kaplan-Meier plotter.

