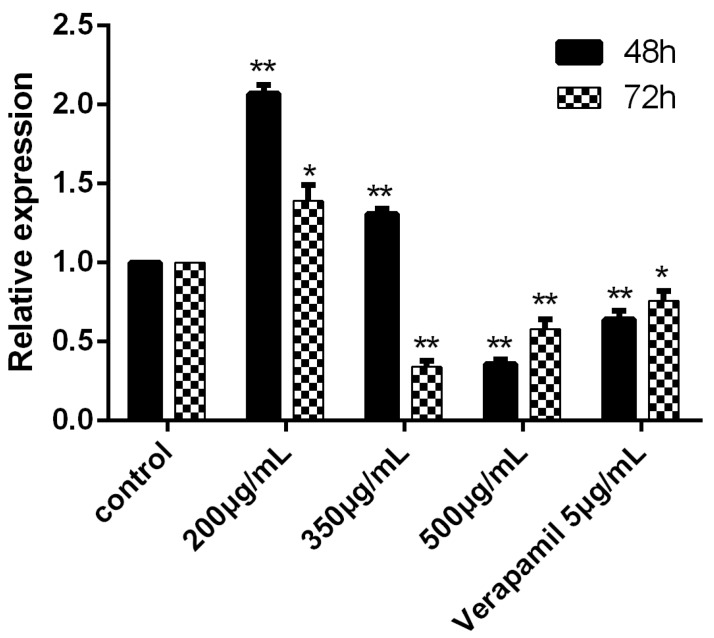
Figure 3.
The expression of MDR1 determined by RT-PCR after cultured with drugs for 48h and 72h. The control group was K562/ADR and the MDR1 gene of this group was reference gene, the relative expression was 1. In other groups, the relative expression would be determined after the Ct, ∆Ct and ∆∆Ct were figured put. *P<0.05 vs control group, **P<0.01 vs. control group.

