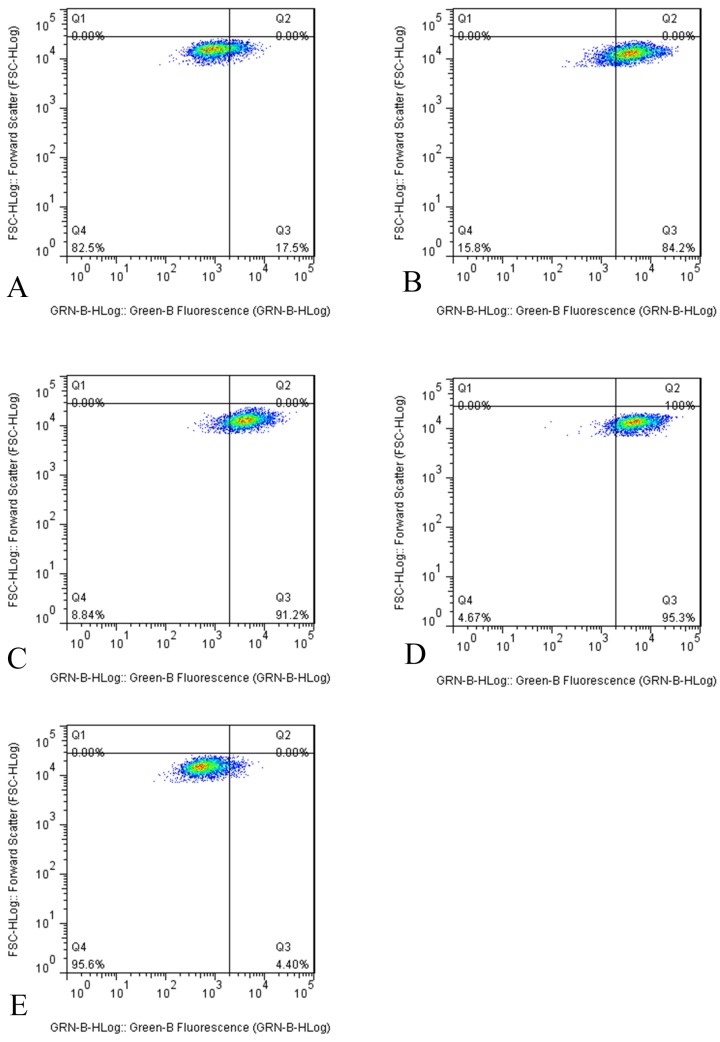
Figure 4.
The P-gp activity detected by flow cytometry. The abscissa Green-B Fluorescence intensity represents the FITC staining. and the ordinate Forward Scatter reflects the cells size. The Q4 quadrant means P-gp negative and the Q3 quadrant means P-gp positive. A: K562/ADR + Adriamycin, B: K562/ADR + 200μg/mL + Adriamycin, C: K562/ADR + 350μg/mL + Adriamycin, C: K562/ADR + 500μg/mL + Adriamycin, D: K562/ADR + 5μg /mL Verapamil + Adriamycin

