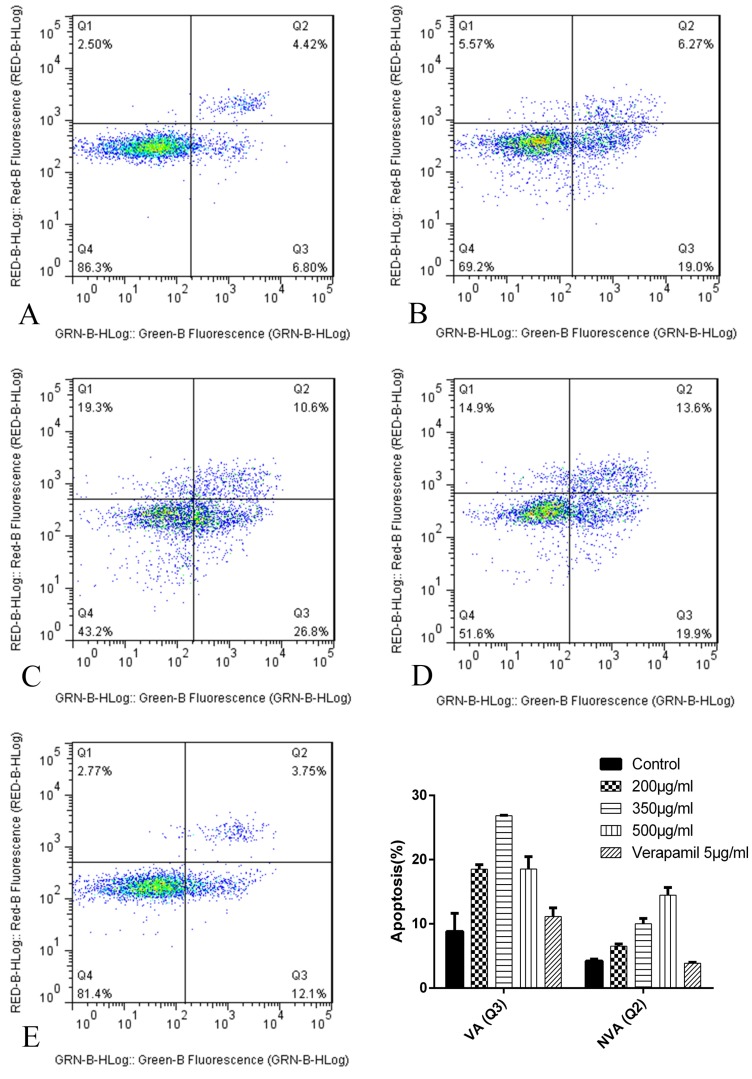
Figure 8.
The apoptosis results by flow cytometry after 24h. The abscissa Green-B Fluorescence intensity represents the FITC staining. and the ordinate Red-B Fluorescence intensity represents the PI staining. The Q1 for necrotic cells, Q2 for quadrant for non-viable apoptotic cells (NVA), Q3 for viable apoptotic cells (VA) and Q4 for normal cells. A: K562/ADR + Adriamycin; B: K562/ADR + 200μg/mL + Adriamycin; C: K562/ADR + 350μg/mL + Adriamycin; C: K562/ADR + 500μg/mL + Adriamycin; D: K562/ADR + 5μg/mL Verapamil + Adriamycin. *P<0.05 vs. control group K562/ADR.

