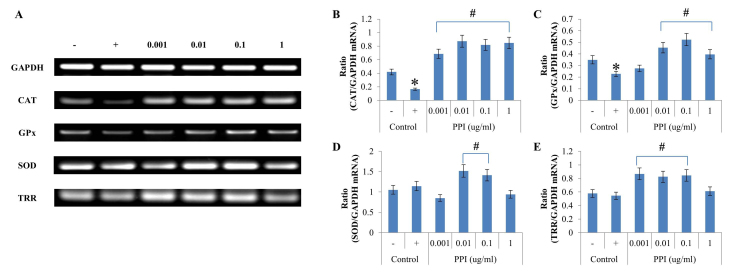
Figure 4.
Effects of PPI on antioxidant enzymes mRNA expressions in H2O2 treated HepG2 cells. (A) Reverse transcription-polymerase chain reaction analysis of SOD, GPx, CAT and TRR. (B-E) Data quantification of antioxidant enzyme/GAPDH mRNA expression for (B) CAT, (C) GPx, (D) SOD, and (E) TRR. Values represent the mean ± standard deviation (n=3). *P<0.05 vs. untreated control; #P<0.05 vs. H2O2-treated control. -, control cells without H2O2; +, control cells treated with 1 mM H2O2; CAT, catalase; GPx, glutathione peroxidase; H2O2, hydrogen peroxide; PPI, peptidylprolyl cis-trans isomerase; ROS, reactive oxygen species; SOD, superoxide dismutase; TRR, thioredoxin reductase.

