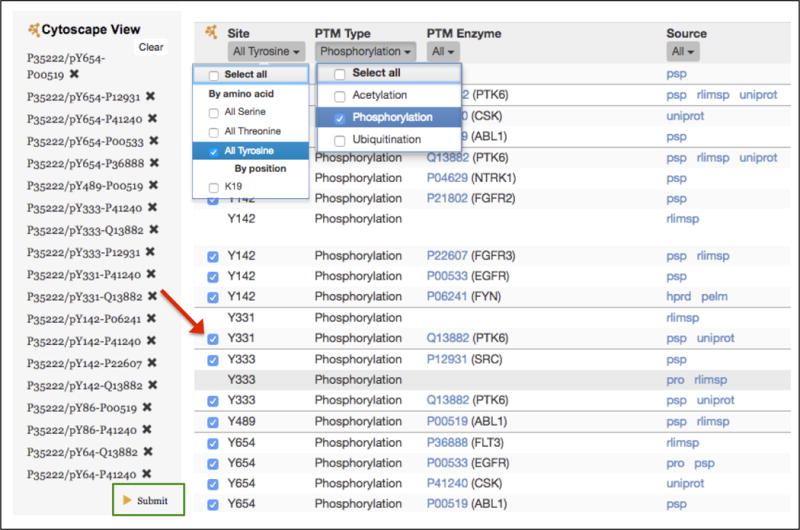
Figure 8.

Portion of the human CTNNB1 entry page illustrating how to construct a custom Cytoscape network view of tyrosine phosphorylation of CTNNB1. The right side of the figure shows the settings for filtering the CTNNB1 as substrate table to show only tyrosine phosphorylation sites. Clicking the checkboxes next to the tyrosine sites (red arrow) adds these relations to the custom Cytoscape View panel (left). Clicking on the Submit button (outlined in green) will display the network.
