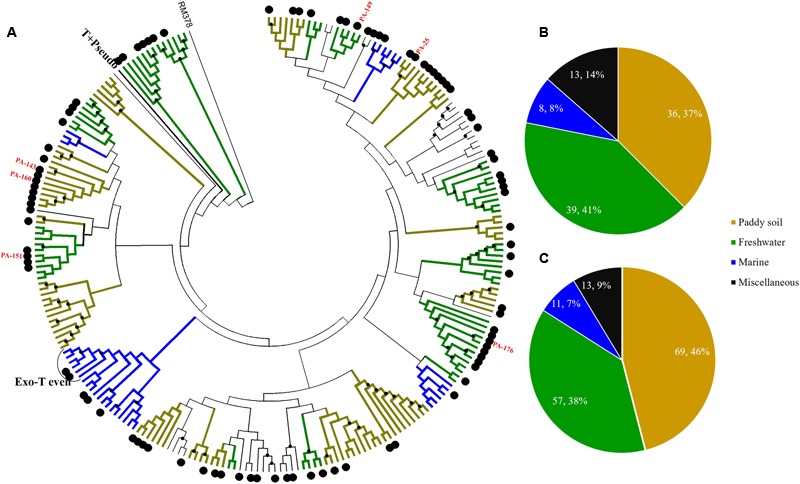
FIGURE 4.

Phylogenetic analysis of g23 OTUs amino acid sequences obtained at Site A with those obtained from marine water, freshwater lakes, and paddy soils (A), and number of g23 OTUs (B), and clones (C) from Site A in different environmental groups. In the phylogenetic analysis, the large black dots indicate sedimentary sequences and the small black dots indicate internal nodes with a >50% bootstrap support. Different colored branches indicate g23 groups from different environments: marine water (blue), freshwater lakes (green), and paddy soils (yellow).
