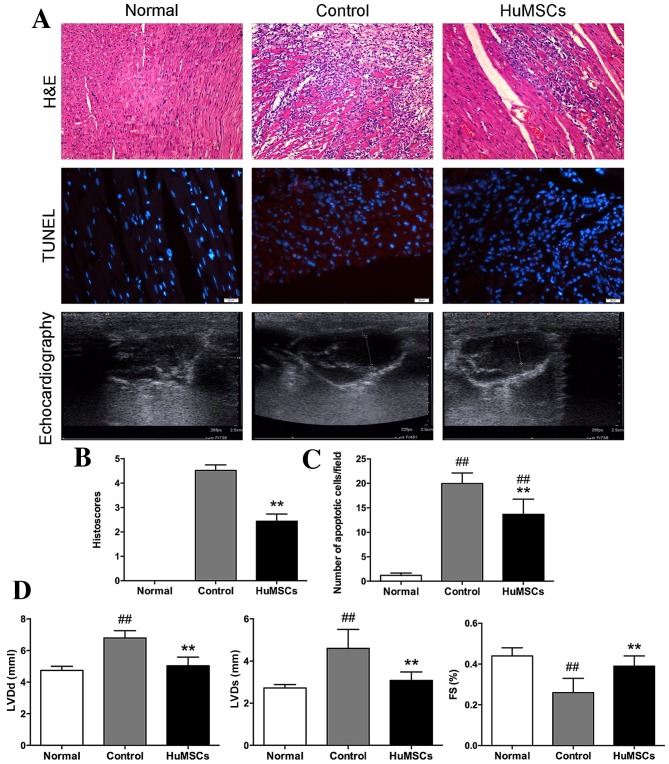
Figure 1.
Experiments comparing cellular infiltration, levels of apoptosis and systolic and diastolic components in normal cells, control cells and HuMSCs. (A) H&E staining of left ventricular tissue slices (magnification, ×100). TUNEL staining of left ventricular tissue slices depicting apoptotic nuclei (magnification, ×400). Echocardiography in four chambers. (B) Histoscores of H&E staining reflecting levels of cardiac infiltration. (C) Bar graphs presenting the average number of TUNEL-positive cells per field. (D) Quantification of LVDs, LVDd and FS. Data are expressed as the mean ± standard deviation. ##P<0.01 vs. Normal, **P<0.01 vs. Control. HuMSCs, human umbilical-derived mesenchymal stem cells; TUNEL, terminal deoxynucleotidyl transferase dUTP nick end labeling; LVDs, left ventricular systolic dimension; LVDd, left ventricular diastolic dimension; FS, fractional shortening.

